 GIS and Media fusion
"The explosive growth of the GeoWeb and geographic information has made GIS powerful media for the general public to communicate, but perhaps more importantly, GIS have also become media for constructive dialogs and interactions about social issues." - Sui & Goodchild
User Tools
This is an old revision of the document!
Table of Contents
GéoInf17 : Evaluation - rattrapage
Barème : ~ équipondéré.
1) OL3 - fonction de style
Utiliser le code ci-dessous comme point de départ et qui affiche une carte centrée sur la Suisse avec une couche de base de type Bing.
<html>
    <head>
        <title>ol3 - ExaRattrapage - Swiss votations UEMARS2001</title>
        <script type="text/javascript" src="js/config.js"></script>

        <script type="text/javascript">
            var map;
            $(document).ready(function () {
                map = new ol.Map({
                    target: 'map',
                    layers: [
                        new ol.layer.Tile({
                            source: new ol.source.BingMaps({
                                key: 'AqE05oJsq-bWa50FPOW2S0eQm9Oqqygc1VTi_WPhUIoKR_-jgA559CRbfndgWAIz',
                                imagerySet: 'CanvasGray'
                            })
                        })
                    ]
                });
                map.getView().setCenter(ol.proj.transform([8.2, 46.8], "EPSG:4326", "EPSG:3857"));
                map.getView().setZoom(9);

                /* A vous de jouer ...
                 * - ajouter une couche utilisant le flux votations.geojson fourni
                 * - ajuster son style selon instructions et illustration
                */
            });

        </script>
        <style type="text/css">
            #map {
                width: 100%;
                height: 100%;
            }
        </style>
    </head>
    <body>
        <div id="map"></div>
    </body>
</html>
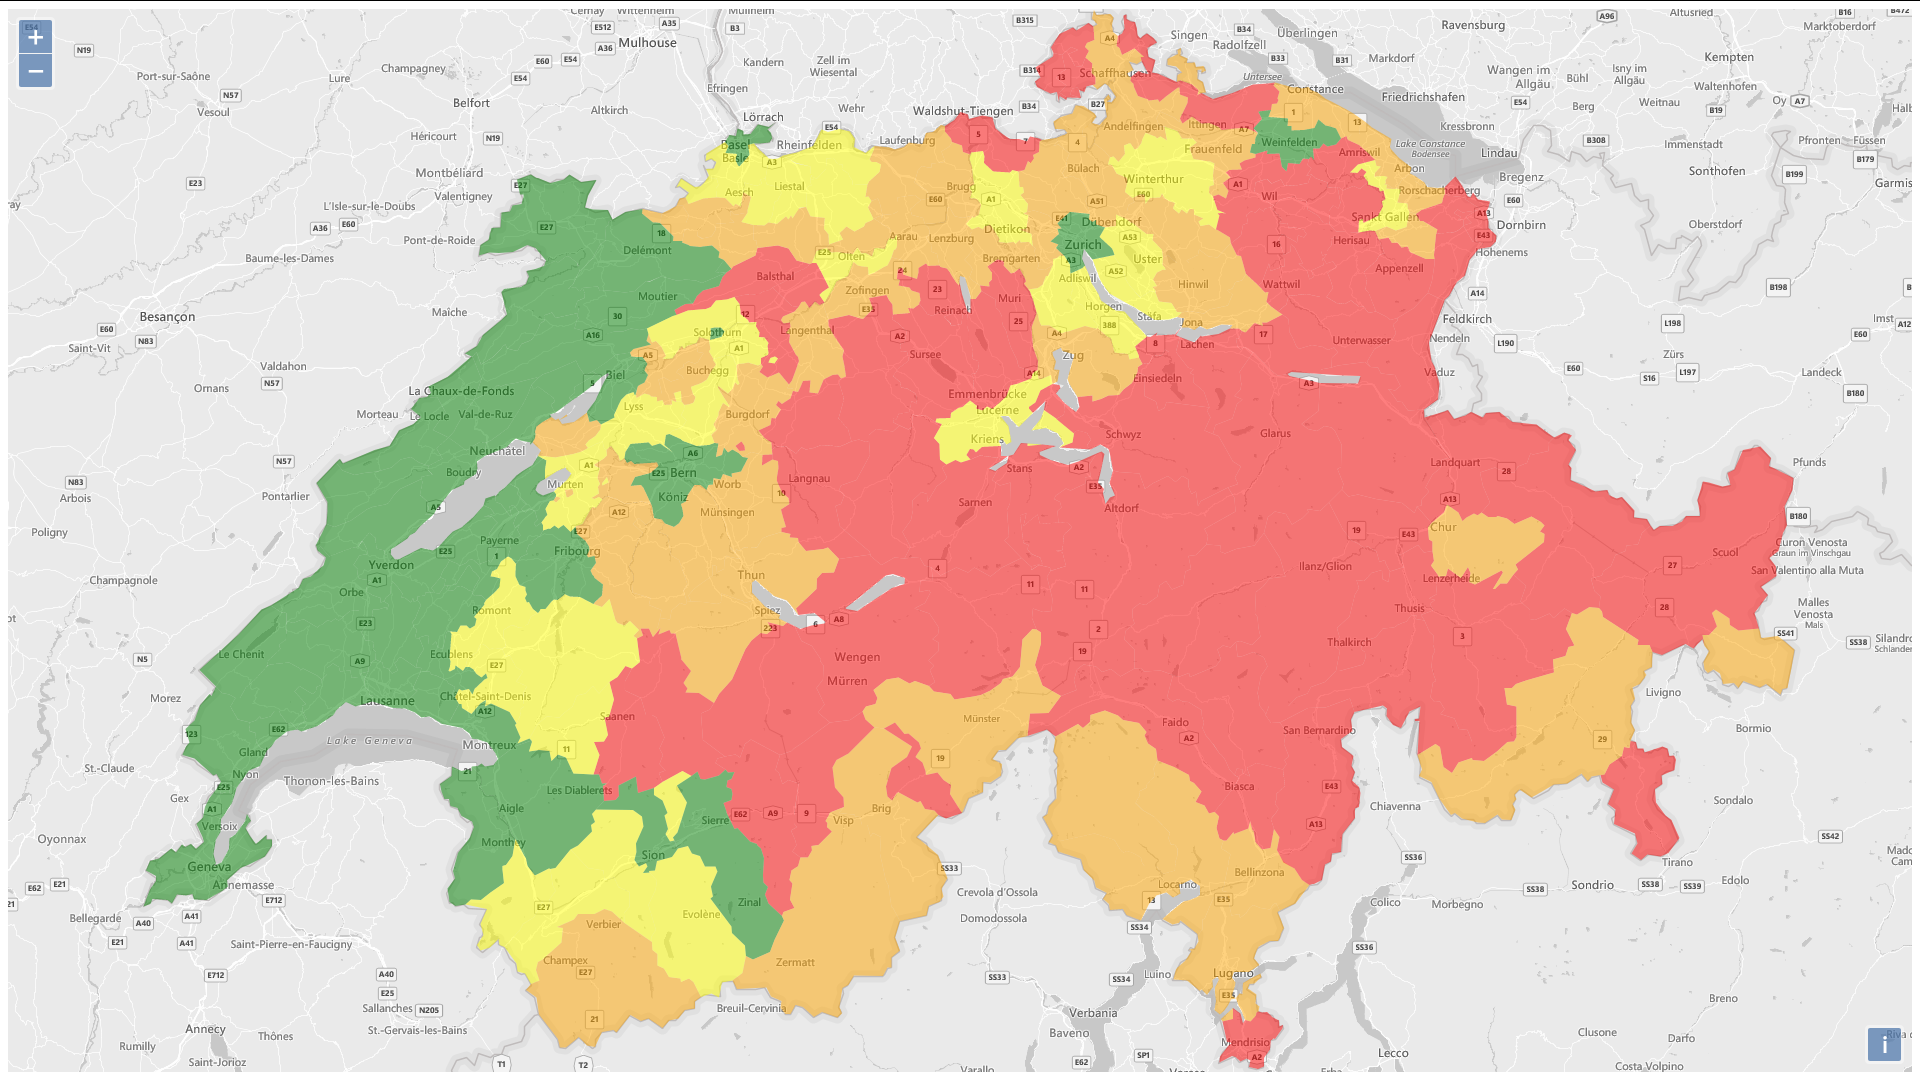
On vous fournit un flux GeoJSON des districts de Suisse avec quelques attributs dont le champ 'uemars2001' qui contient les résultats d'une votation concernant l'adhésion à l'UE (ce flux a été exporté depuis ce dataset stocké chez Carto.com).
Il s'agit :
- d'ajouter une couche de superposition qui utilise ce flux et ensuite d'en adapter le style comme suit
- en fonction de la valeur du champ 'uemars2001' et selon illustration on souhaite distinguer les districts qui ont répondu :
- NON à l'adhésion à l'UE à moins de 75% (à colorer en vert)
- à moins de 80% (en jaune)
- à moins de 85% (en orange)
- le reste en rouge.
2) CartoCSS - plan de Vevey
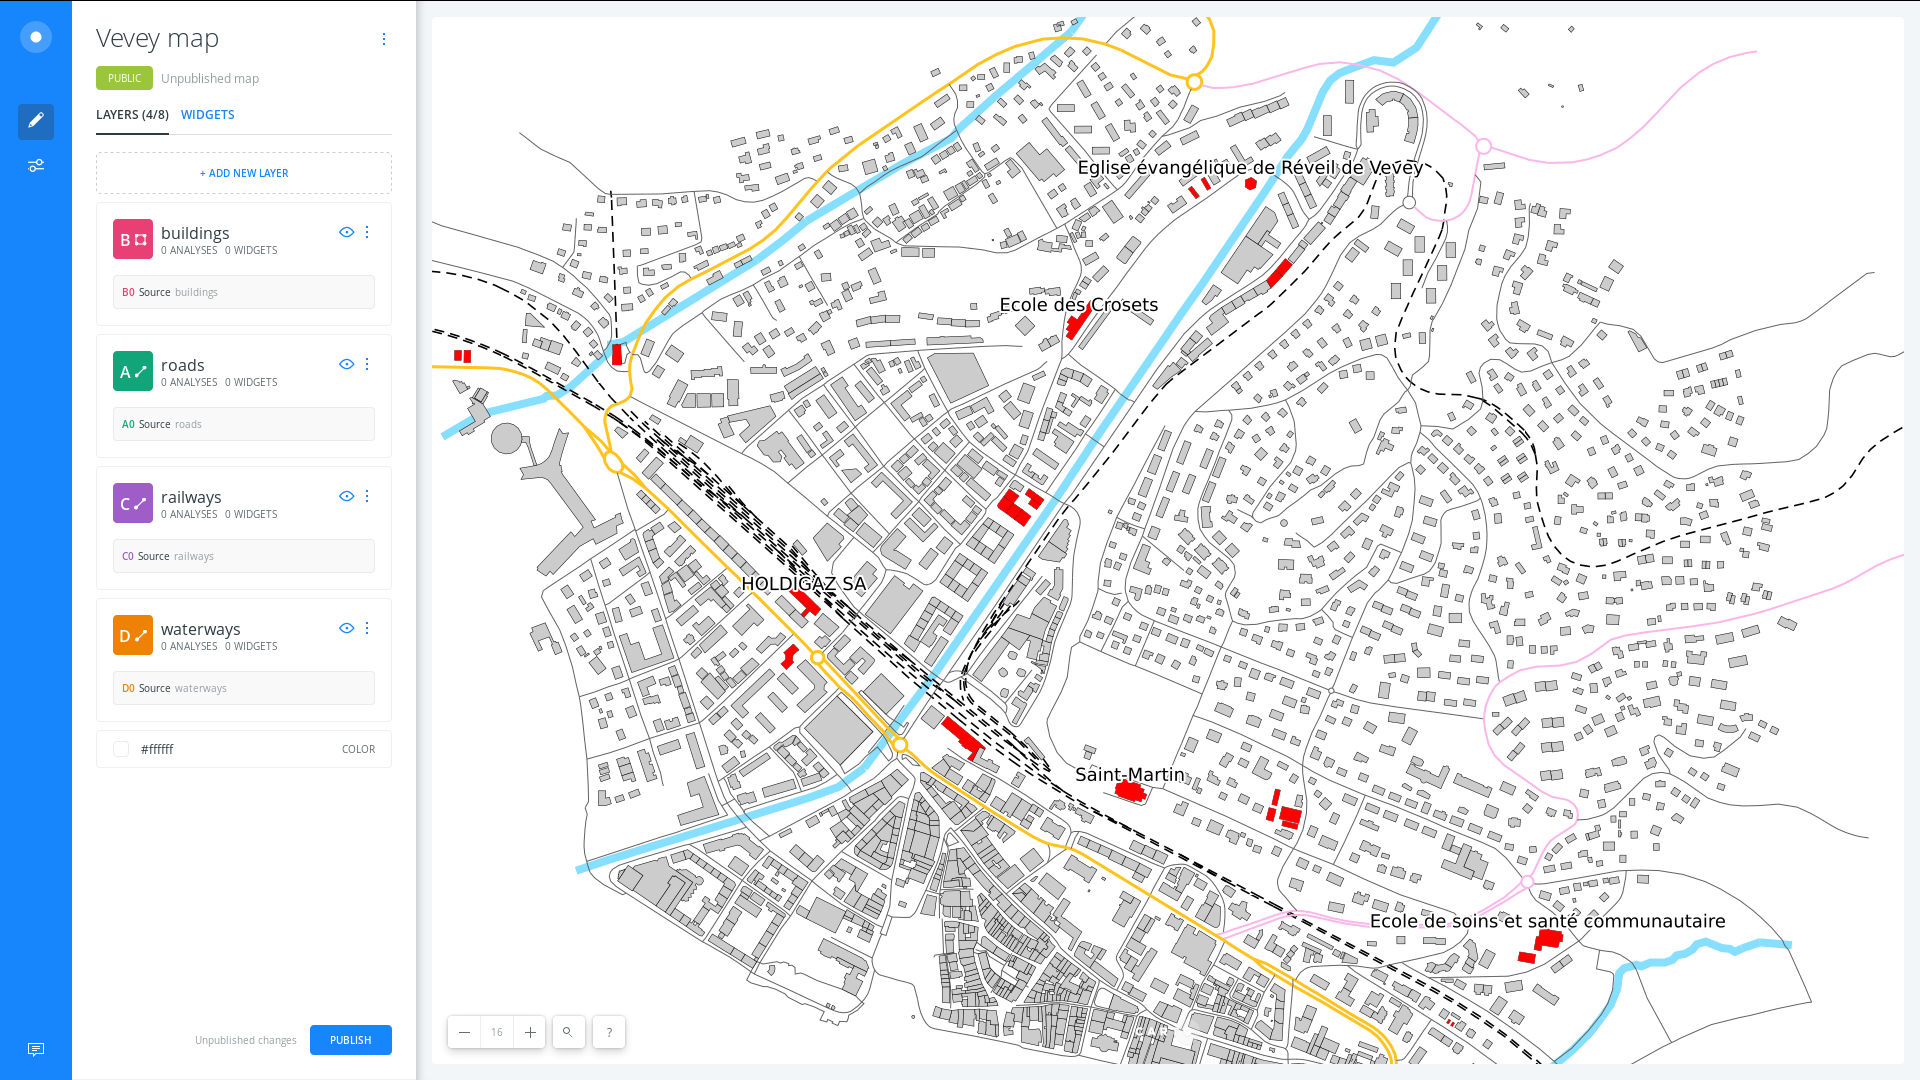
Votre collègue, Candide, est parti en congés sans terminer l'habillage cartographique du projet “Vevey map”. Il vous demande de le terminer selon l'illustration ci-dessous et les informations suivantes qu'il a bien voulu vous laisser :
- Je te laisse mes accès à mon compte carto.com (login: candid74, pass: geoinf17)
- Le projet Vevey map est ici : https://candid74.carto.com/builder/d489f126-6dc6-4c56-8b18-33a3ec175507
- Ma carte se compose de 4 couches : waterways, railways, roads et buildings
- Actuellement chacune a un style par défaut qui est insuffisant (hormis waterways qui est bien comme ça)
- Je souhaite représenter la couche :
- railways en trait-tillé
- roads en distinguant les routes selon valeur du champ fclass ('primary' en orange, 'secondary' en rose et 'tertiary', 'residential', 'pedestrian' en gris)
- buildings en distinguant les batiments selon valeur du champ type comme suit : les entités qui portent une valeur pour ce champ (ex. 'church', 'train_station', etc) sont en rouge, les autres en gris
- Rappel : dans le fichier de style g4districts.mss de l'exemple Ex4E_2.html du cours nous avons utilisé quelque-chose de très pratique qui peut être utile ici.
Quelles sont les instructions CartoCSS pour chaque couche et qui répondent à ces souhaits en produisant le résultat illustré ci-dessous ?
3) Un peu de SQL Spatial
