 GIS and Media fusion
"The explosive growth of the GeoWeb and geographic information has made GIS powerful media for the general public to communicate, but perhaps more importantly, GIS have also become media for constructive dialogs and interactions about social issues." - Sui & Goodchild
User Tools
Table of Contents
Workshop OpenLayers v2
Dans OpenLayers, une carte est un ensemble de couches associée à des contrôles pour gérer l'interaction avec l'utilisateur. Une carte se construit avec trois ingrédients de base : du balisage HTML, des déclarations de style CSS, et du code JavaScript d'initialisation.
1. Les bases
- Pour ce workshop, télécharger le matériel de départ ol2014-workshop.zip
- Décompresser l'archive dans un répertoire projet dans votre serveur web en reconfigurant le fichier js/config.js comme suit :
 var myWMS = "https://eu1.mapcentia.com/wms/oertz/public";
 var myWFS = "https://eu1.mapcentia.com/wfs/oertz/public/4326";
- Il faut alors utiliser ce proxy_2.php qui fonctionne aussi avec des requêtes HTTPS et qui est à utiliser dans js/config.js.
- A noter pour la suite, ceci qui pourra être très utile : OpenLayers API docs, OpenLayers examples
Ex1A : créer une carte, un premier exemple pour comprendre
<html>
    <head>
        <title>Ex1A - create a first map with a WMS layer</title>

        <script type="text/javascript" src="js/config.js"></script>
        <script type="text/javascript">
            var map;
            $(document).ready(function(){
                map = new OpenLayers.Map('map');
                wms = new OpenLayers.Layer.WMS(
                            "World boundaries",
                            myWMS,
                            {
                                version: "1.1.1",
                                layers: 'public.world_simple',
                                format: 'image/png'
                            },
                            {
                                singleTile: true
                            }
                        );
                map.addLayer(wms);
                map.zoomToMaxExtent();
            });
        </script>

        <style type="text/css">
            #map {
                width: 100%;
                height: 100%;
            }
        </style>
    </head>
    <body>
        <div id="map"></div>
    </body>
</html>
Balisage HTML et déclarations CSS
- Le bloc <div> d'ID map est la cible de visualisation (la vue cartographique)
- C'est la position et la taille de cette div qui déterminent comment la vue s'intègre dans l'interface
- OpenLayers est accompagné de nombreuses prédéfinitions de déclarations CSS
TODO
- Où sont-elles décrites ?
- Trouvez celles qui habillent les boutons zoomin/zoomout !
- Ajoutez le code HTML ci-dessous avant la div ainsi que le CSS (voir OpenLayers.Control.Zoom)
<a href="#" id="olZoomInLink"><img src="images/zoomin.png" class="zoomHover"></a>
<a href="#" id="olZoomOutLink"><img src="images/zoomout.png" class="zoomHover"></a>
.zoomHover:hover {
   background: lightskyblue;
}
Initialisation de la carte
- L'objet OpenLayers.Map est associé à l'ID de la cible de visualisation
- Un objet OpenLayers.Layer est défini pour chaque couche à ajouter à la carte
- L'objet OpenLayers.Layer.WMS permet de définir les paramètres d'une requête WMS pour obtenir une couche servie par un serveur cartographique conforme au standard OGC WMS (http://www.opengeospatial.org/standards/wms)
- La méthode zoomToMaxExtent termine l'initialisation en définissant l'enveloppe géographique de visualisation (par défaut tout le globe)
TODO
- Remplacer map.zoomToMaxExtent comme suit (voir zoomToExtent)
//map.zoomToMaxExtent();
map.zoomToExtent([-18,38,38,55]);
console.log(map.getProjection());
- Quelle différence en modifiant comme suit l'option singleTile de la définition OpenLayers.Layer.WMS ?
//singleTile: true
singleTile: false
- Rendre visible la grille régulière des tuiles en plaçant l'instruction CSS ci-dessous au bon endroit
border: 1px solid red;
- Rechercher et tester d'autres couches de serveurs cartographiques WMS (par exemple de celui-ci : http://maps.opengeo.org/geowebcache/service/wms?request=GetCapabilities)
2. Cache de tuiles
Avec singleTile à false, le client contrôle la grille de tuiles qu'il peut garder en cache. Néanmoins, à chaque requête initiale de tuile, tout le processus de rendu cartographique se fait. Mais puisqu'une couche de tuiles fait des requêtes d'images selon une grille régulière, il est possible pour le serveur de préparer un cache de ces images.
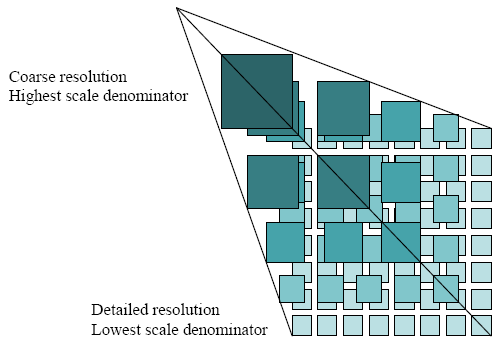
Le service cartographique WMS permettant une grande flexibilité en terme de ce que le client peut demander. Côté serveur, cela rend difficile la mise en cache. A l'extrême opposé, un service peut aussi offrir des tuiles pour un ensemble prédéfini de niveaux de zoom et pour une grille régulière prédéfinie. On parle de couches de tuiles avec une source XYZ - avec X et Y indiquant la colonne et la rangée de la grille et Z le niveau de zoom. Il faut voir cela comme une pyramide de tuiles.
Ex2A : OpenLayers.Layer.OSM
<html>
    <head>
        <title>Ex2A - webmap with tiled layer</title>

        <script type="text/javascript" src="js/config.js"></script>
        <script type="text/javascript">
            var map;
            $(document).ready(function() {
                map = new OpenLayers.Map('map');

                osm = new OpenLayers.Layer.OSM("Simple OSM Map");
                map.addLayer(osm);

                map.zoomToMaxExtent();
            });
        </script>

        <style type="text/css">
            #map {
                width: 100%;
                height: 100%;
            }
        </style>
    </head>
    <body>
        <div id="map"></div>
    </body>
</html>
TODO
- Modifier le centrage de la carte comme suit :
//map.zoomToMaxExtent(); map.setCenter(new OpenLayers.LonLat(6.15,46.2).transform("EPSG:4326","EPSG:3857"), 10); - Insérer en fin de code du callback ready les logs ci-dessous :
console.log("Map projection: " + map.getProjection()); console.log("Map extent: " + map.getExtent()); console.log("LonLat Mercator: " + new OpenLayers.LonLat(6.15,46.2).transform("EPSG:4326","EPSG:3857")); console.log("LonLat Google: " + new OpenLayers.LonLat(6.15,46.2).transform("EPSG:4326","EPSG:900913")); - Remplacer la définition de la couche OpenLayers.Layer.OSM comme suit :
osm = new OpenLayers.Layer.OSM("UrbanGene Custom OSM", "http://urbangene.heig-vd.ch/tilecache/${z}/${x}/${y}.png"); - Remplacer la définition de la couche comme suit :
osm = new OpenLayers.Layer.OSM("OSM tiles restyled by MapBox",
          "http://api.tiles.mapbox.com/v3/oertz.map-i2ak2ozc/${z}/${x}/${y}.png",
          {
             attribution: "Based on <a href='www.openstreetmap.org'>OpenStreetMap</a> / MapBox restyled by oertz :: HEIG-VD"
          }
);
et ajouter l'instruction CSS suivante :
.olControlAttribution {
      background-color: lightgray;
      opacity: 0.6;
      position: relative !important;
      left: 50px;
      top: 0px;
}
Ex2B : OpenLayers.Layer.Google
L'utilisation d'un cache serveur de tuiles a largement été popularisé par des services propriétaires comme Google Maps. OpenLayers étant indépendant de toute source de données, l'API offre également un type de couche pour dialoguer avec de tels services.
TODO
- Partir de l'exemple précédent en adaptant le code JavaScript comme suit :
<script type="text/javascript" src="js/config.js"></script> <script src="http://maps.google.com/maps/api/js?v=3&sensor=false"></script> <script type="text/javascript"> var map; $(document).ready(function() { map = new OpenLayers.Map('map', { projection: new OpenLayers.Projection("EPSG:3857"), maxExtent: new OpenLayers.Bounds(-20037508, -20037508, 20037508, 20037508), }); goog = new OpenLayers.Layer.Google("Google layer", { type: google.maps.MapTypeId.TERRAIN, sphericalMercator: true } ); map.addLayer(goog); map.setCenter(new OpenLayers.LonLat(8, 47).transform("EPSG:4326", "EPSG:900913"), 6); }); </script> - Modifier le paramètre de type de couche selon la documentation Google Maps API. Contrairement à un service WMS, le service de Google Maps se sait pas s'auto-décrire). Mais comme il n'y a qu'un seul service Google Maps au monde, une documentation suffit.
Ex2C : OpenLayers.Layer.WMTS
Swisstopo offre un service de tuiles basé sur le standard WMTS et que l'on peut exploiter comme suit.
<html>
    <head>
        <title>Ex2C - use of Geoadmin WMTS</title>
        <script type="text/javascript" src="js/config.js"></script>
        <script type="text/javascript" src="js/proj4js/proj4js-compressed.js"></script>
        <script type="text/javascript" src="js/proj4js/defs/EPSG21781.js"></script>

        <script type="text/javascript">
            var map;
            $(document).ready(function() {
                map = new OpenLayers.Map({
                    div: "map",
                    projection: "EPSG:21781",
                    units: "m",
                    resolutions: [650, 500, 250, 100, 50, 20, 10, 5, 2.5, 2, 1.5],
                });

                pixelkartefarbe = new OpenLayers.Layer.WMTS({
                    name: "Swisstopo PK",
                    url: ["http://wmts0.geo.admin.ch/", "http://wmts1.geo.admin.ch/", "http://wmts.geo.admin.ch/"],
                    layer: "ch.swisstopo.pixelkarte-farbe",
                    requestEncoding: "REST",
                    formatSuffix: "jpeg",
                    matrixSet: "21781",
                    format: "image/jpeg",
                    serverResolutions: [4000, 3750, 3500, 3250, 3000, 2750, 2500, 2250, 2000, 1750, 1500, 1250, 1000, 750, 650, 500, 250, 100, 50, 20, 10, 5, 2.5, 2, 1.5, 1, 0.5],
                    style: "default",
                    maxExtent: new OpenLayers.Bounds(420000, 30000, 900000, 350000),
                    isBaseLayer: true,
                    opacity: 1.0,
                    dimensions: ['TIME'],
                    params: {'time': 20130213}
                });
                map.addLayer(pixelkartefarbe);

                map.zoomToMaxExtent();
            });

        </script>

        <style type="text/css">
            #map {
                width: 100%;
                height: 100%;
            }
        </style>
    </head>
    <body>
        <div id="map"></div>
    </body>
</html>
TODO
- Modifier le centrage comme suit :
map.setCenter(new OpenLayers.LonLat(7.658, 45.98).transform("EPSG:4326", "EPSG:21781"), 6); - Modifier le centrage comme suit :
map.setCenter(new OpenLayers.LonLat(600000, 200000), 8);
- Modifier les paramètres suivant de la définition OpenLayers.Layer.WMTS :
layer: "ch.swisstopo.hiks-dufour",
...
formatSuffix: "png",
...
format: "image/png",
...
params: {'time': 18450101}
3. Style de couche "image"
Pour le moment, c'est le serveur qui fait tourner son moteur cartographique pour créer une représentation image des données géographiques et ceci sur la base de styles prédéfinis. Voyons comment le client peut dire son mot et piloter le style “à distance”.
Ex3A : Styling avec WMS
Le standard WMS offre beaucoup de libertés, parfois au détriment de la performance. Comme il permet de demander ce que l'on veut en termes d'enveloppe géographique (paramètre bbox) et de style parmis un ensemble de styles pré-configurer, il est possible d'envoyer au serveur cartographique des instructions personnalisées de style.
<html>
    <head>
        <title>Ex3A - use of a custom SLD style</title>
        <script type="text/javascript" src="js/config.js"></script>
        <script type="text/javascript">
            var map;
            $(document).ready(function(){
                map = new OpenLayers.Map('map');
                wms = new OpenLayers.Layer.WMS(
                            "World boundaries",
                            myWMS,
                            {
                                version: '1.1.1',
                                SLD: 'http://ogo.heig-vd.ch/ol2014/sld/pinkWorld.sld.xml',
                                format: 'image/png'
                            }, { singleTile: true }
                        );
                map.addLayer(wms);
                map.zoomToMaxExtent();
            });
        </script>

        <style type="text/css">
            #map {
                width: 100%;
                height: 100%;
            }
        </style>
    </head>
    <body>
        <div id="map"></div>
    </body>
</html>
TODO
- Comment OpenLayers sait-il qu'il faut interroger l'habituelle couche public.world_simple ?
- Avec Firefox RESTClient (ou autre équivalent), lancer la requête POST suivante sur le serveur WMS :
<?xml version="1.0" encoding="UTF-8"?>
<DescribeFeatureType version="1.1.0" service="WFS"
                     xmlns="http://www.opengis.net/wfs"
                     xmlns:xsi="http://www.w3.org/2001/XMLSchema-instance"
                     xsi:schemaLocation="http://www.opengis.net/wfs http://schemas.opengis.net/wfs/1.1.0/wfs.xsd">
	             <TypeName>world_simple</TypeName>
</DescribeFeatureType>
puis lancer
<?xml version="1.0" encoding="UTF-8"?> <GetFeature version="1.1.0" service="WFS" xmlns="http://www.opengis.net/wfs" xmlns:xsi="http://www.w3.org/2001/XMLSchema-instance" xsi:schemaLocation="http://www.opengis.net/wfs http://schemas.opengis.net/wfs/1.1.0/wfs.xsd"> <Query typeName="world_simple"> <PropertyName>region</PropertyName> </Query> </GetFeature> - Créer votre propre pinkWorld.sld.xml en y insérant l'instruction Filter suivante en début de Rule (ex. mettre ce fichier dans un espace type Dropbox pour que le serveur WMS puisse y accéder)
... <Rule> <Filter xmlns="http://www.opengis.net/ogc"> <PropertyIsEqualTo> <PropertyName>region</PropertyName> <Literal>NorthAfrica</Literal> </PropertyIsEqualTo> </Filter> <PolygonSymbolizer> ... - Ajouter la Rule suivante après la première :
... </Rule> <Rule> <ElseFilter/> <PolygonSymbolizer> <Fill> <CssParameter name="fill">#DDDDDD</CssParameter> <CssParameter name="fill-opacity">1.0</CssParameter> </Fill> <Stroke> <CssParameter name="stroke">#000000</CssParameter> <CssParameter name="stroke-width">1</CssParameter> </Stroke> </PolygonSymbolizer> </Rule> </FeatureTypeStyle> ... - Modifier le style pour que la Suisse soit représentée comme ci-dessous.
- voir la spécification Styled Layer Descriptor
- et le tutoriel SLD

Ex3C : Custom tiling service with CartoCSS
- Introduction avec MapBox et exercices : cartocss.pdf
- Symbol drawing order : schema & documentation
<html>
    <head>
        <title>Ex3C - webmap with your own MapBox basemap</title>

        <script type="text/javascript" src="js/config.js"></script>
        <script type="text/javascript">
            var map;
            $(document).ready(function() {
                map = new OpenLayers.Map('map');

                var token = "pk.eyJ1IjoiamZyZXlyZSIsImEiOiIwMnZKUHR3In0.8YWGPOTZ3bFglVmnCvWjvw";
                var styleId = "jfreyre.c74df3e5";

                var mbLayer = new OpenLayers.Layer.OSM("My Map Layer",
                                "http://a.tiles.mapbox.com/v4/" + styleId + "/${z}/${x}/${y}.png?access_token=" + token
                              );
                map.addLayer(mbLayer);

                map.setCenter(new OpenLayers.LonLat(6.7, 46.7).transform("EPSG:4326", "EPSG:3857"), 10);
            });
        </script>

        <style type="text/css">
            #map {
                width: 100%;
                height: 100%;
            }
        </style>
    </head>
    <body>
        <div id="map"></div>
    </body>
</html>
TODO
- Modifier le nécessaire de ci-dessus pour créer une application geoweb utilisant votre style MapBox.
4. Composition de couches
Un intérêt d'une carte en ligne est de pouvoir la composer à partir de plusieurs couches.
Ex4A : Composition "server-side"
La composition peut se faire par un assemblage côté serveur. L'Ex3C a déjà bien montré comment préparer un tel assemblage. Ci-dessous un assemblage “à la demande”. Notez bien, plus il y a de couches disponibles sur le serveur cartographique, plus il y a de combinaisons.
<html>
    <head>
        <title>Ex4A - one WMS request for two layers</title>
        <script type="text/javascript" src="js/config.js"></script>
        <script type="text/javascript">
            var map;
            $(document).ready(function(){
                map = new OpenLayers.Map('map');
                wms = new OpenLayers.Layer.WMS(
                            "world_simple + cities",
                            myWMS,
                            {
                                // les couches à assembler dans une image cartographique
                                layers: 'public.world_simple,public.cities',
                                format: 'image/png'
                            }, { singleTile: true }
                        );
                map.addLayer(wms);
                map.setCenter(new OpenLayers.LonLat(7, 47), 5);
            });
        </script>

        <style type="text/css">
            #map {
                width: 100%;
                height: 100%;
            }
        </style>
    </head>
    <body>
        <div id="map"></div>
    </body>
</html>
TODO
- Apporter la preuve que l'assemblage s'est fait côté serveur
- Trouver un tel type d'assemblage parmi les Basic Map Types de l'API Google Maps,
Ex4B : Composition "client-side"
Un cadre applicatif de cartographie en ligne se doit de fournir la capacité de gérer la composition côté client. C'est le cas d'OpenLayers comme ci-dessous :
<html>
    <head>
        <title>Ex4B - two WMS base layers</title>
        <script type="text/javascript" src="js/config.js"></script>
        <script type="text/javascript">
            var map;

            $(document).ready(function(){
                map = new OpenLayers.Map('map');
                map.addControl(new OpenLayers.Control.LayerSwitcher({'ascending':false}));

                world = new OpenLayers.Layer.WMS(
                            "World admin boundaries",
                            myWMS,
                            {
                                layers: 'public.world_simple',
                                format: 'image/png'
                            }, { singleTile: true }
                        );


                cities = new OpenLayers.Layer.WMS(
                            "World cities",
                            myWMS,
                            {
                                layers: 'public.cities',
                                format: 'image/png'
                            }, { singleTile: true,isBaseLayer:false }
                        );
                map.addLayer(world);
                map.addLayer(cities);

                map.setCenter(new OpenLayers.LonLat(7, 47), 5);
            });
        </script>

        <style type="text/css">
            #map {
                width: 100%;
                height: 100%;
            }
        </style>
    </head>
    <body>
        <div id="map"></div>
    </body>
</html>>
TODO
- Est-ce vraiment ce que l'on veut (remarquer le nouveau contrôle apparu dans l'IHM) ?
- Comment faire pour vraiment assembler/superposer ces deux couches côté client ?
- Partant de Ex2B, créer une application de webmapping avec la composition suivante :
- une couche de base Google (ex. TERRAIN)
- une superposition basée sur la couche ch.swisstopo.pixelkarte-pk25.metadata-kartenblatt servie par le serveur WMS http://wms.geo.admin.ch de Swisstopo (voir doc GeoAdmin)
Illustration du résultat attendu :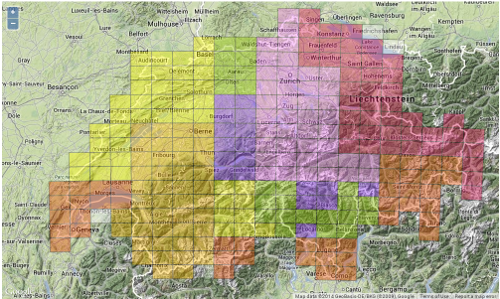
- Ajouter en superposition votre style MapBox représentant les communes de Suisse (cf. Ex3C - Introduction) comme ci-dessous :
Illustration du résultat attendu :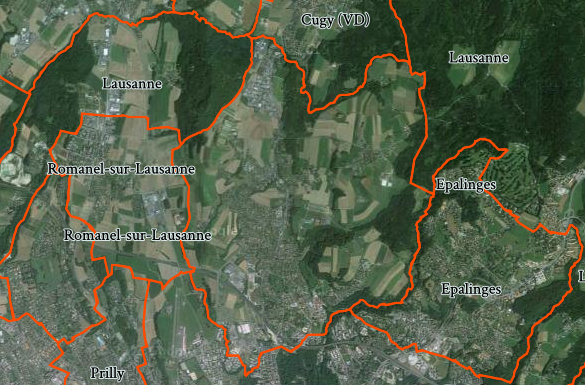
- Remplacer la couche de base Google Maps par la couche MapBox examples.map-i86nkdio


Corrigé : http://ogo.heig-vd.ch/ol2014/Ex4B_3.html
Ex4C : On-the-fly CartoCSS with CartoDB
Jusqu'à présent, les styles CartoCSS devaient être préparés et chargés avec le Studio vers un compte MapBox. La suite montre une approche plus souple permettant de définir “programmatiquement” le style à appliquer sur une couche de données chargées sur un compte CartoDB.
<html>
    <head>
        <title>Ex4C - webmap with tiled layer</title>

        <script type="text/javascript" src="js/config.js"></script>
        <script src="http://libs.cartocdn.com/cartodb.js/v3/3.11/cartodb.core.js"></script>
        <script type="text/javascript">
            var map;
            $(document).ready(function() {
                map = new OpenLayers.Map('map');
                map.addControl(new OpenLayers.Control.LayerSwitcher());

                osm = new OpenLayers.Layer.OSM("Simple OSM Map");
                map.addLayer(osm);

                cartodb.Tiles.getTiles({
                    type: 'cartodb', user_name: 'ogo', sublayers: [{
                            sql: 'SELECT * FROM g4districts98',
                            cartocss: '#g4districts98 { line-color: red; line-width: 2; }'
                        }]
                }, function(tileTemplate) { // create layer with generated tiles URL
                    tilesUrl = tileTemplate.tiles[0]
                            .replace('{s}', 'a')
                            .replace('{z}', '${z}')
                            .replace('{x}', '${x}')
                            .replace('{y}', '${y}');

                    admLyr = new OpenLayers.Layer.XYZ("CH districts",
                            tilesUrl,
                            {
                                sphericalMercator: true,
                                isBaseLayer: false
                            });
                    map.addLayer(admLyr);
                });

                map.setCenter(new OpenLayers.LonLat(6.64, 46.77).transform("EPSG:4326", "EPSG:3857"), 13);
            });
        </script>

        <style type="text/css">
            #map {
                width: 100%;
                height: 100%;
            }
        </style>
    </head>
    <body>
        <div id="map"></div>
    </body>
</html>
TODO
- Adapter le style pour afficher les districts Vaudois différemment des autres (utiliser l'attribut ak avec sa valeur 'VD')
- Adapter l'application pour que le style CartoCSS soit chargé synchronnement depuis un fichier monStyle.mss.
5. Couche "vector"
Dans les sections précédentes nous avons inséré des couches cartographique sous la forme d'images construites par le serveur avec son moteur cartographique. Un serveur cartographique était donc nécessaire.
A l'opposé, pour une couche OpenLayers.Layer.Vector c'est le client qui joue le rôle de moteur cartographique pour créer la visualisation d'entités géographiques (Features en anglais).
Ex5A : Source de données OpenLayers.Format
Une couche OpenLayers.Layer.Vector peut être alimentée par une source de données au format OpenLayers.Format.GeoJSON (voir aussi http://geojson.org). Il existe de nombreux autres formats : OpenLayers.Format.GPX, OpenLayers.Format.GML, OpenLayers.Format.KML, …)
<html>
    <head>
        <title>Ex5A - GeoJSON vector overlay</title>
        <script type="text/javascript" src="js/config.js"></script>
        <script type="text/javascript">
            var map;
            $(document).ready(function() {
                map = new OpenLayers.Map('map');
                osm = new OpenLayers.Layer.OSM("Simple OSM layer");
                map.addLayer(osm);

                vectorLyr = new OpenLayers.Layer.Vector("Vector layer from GeoJSON", {
                    protocol: new OpenLayers.Protocol.HTTP({
                        url: "data/4capitals.json",
                        format: new OpenLayers.Format.GeoJSON({ignoreExtraDims: true})
                    }),
                    strategies: [new OpenLayers.Strategy.Fixed()],
                    projection: new OpenLayers.Projection("EPSG:4326")
                });
                map.addLayer(vectorLyr);

                map.setCenter(new OpenLayers.LonLat(738600, 5840171), 4);
            });
        </script>

        <style type="text/css">
            #map {
                width: 100%;
                height: 100%;
            }
        </style>
    </head>
    <body>
        <div id="map"></div>
    </body>
</html>
TODO
- Apporter la preuve que les données sont bien transformées en objets graphiques côté client !
- Remplacer l'URL source par
http://earthquake.usgs.gov/earthquakes/feed/v1.0/summary/2.5_day.geojson
Pourquoi cela ne fonctionne pas ? …
- Dans une div HTML, afficher la liste des descriptions des séismes –> corrigé : http://ogo.heig-vd.ch/ol2014/0Ex5A.html
- Modifier le paramètre protocol comme suit :
        protocol: new OpenLayers.Protocol.HTTP({
            url: "http://www.visugpx.com/files/download.php?id=1416844831",
            format: new OpenLayers.Format.GPX()
        }),
en recentrant la carte par ici :
map.setCenter(new OpenLayers.LonLat(766225, 5908730),10);
- Notons aussi le Geographic Markup Language de l'OGC qui “consiste en un ensemble de schémas XML qui définissent un format ouvert pour l'échange de données géographiques et permettent de construire des modèles de données spécifiques pour des domaines spécialisés, comme l'urbanisme, l'hydrologie ou la géologie” (source Wikipedia)
Exemple : http://geoc.heig-vd.ch/ogo/olmap/data/fourCapitals.gml
Ex5B : OpenLayers.Layer.Vector sous la loupe
L'exemple ci-dessous décrit en détail ce qu'est une couche OpenLayers.Layer.Vector en montrant comment la créer et l'alimenter à partir d'un format de source de données “fait maison”.
En résumé, une couche OpenLayers.Layer.Vector est composée d'entités géographiques (OpenLayers.Feature.Vector) chacune composée d'une géométrie (ex. OpenLayers.Geometry.Point) et d'une liste d'attributs.
La source de données est un fichier texte formaté comme suit:
2.3332999999999999 48.866700000000002 Paris,7.4333 46.950000000000003 Bern,12.5 41.883299999999998 Rome,-3.71 40.409999999999997 Madrid
La structure de formatage est simple : c'est une suite de triplets “Longitude Latitude Nom” dont le séparateur interne est l'espace. Le séparateur entre triplets est la virgule. Chaque triplet correspond à une entité géographique.
Le code ci-dessous déchiffre cette structure et transforme les triplets en OpenLayers.Feature.Vector.
<html>
    <head>
        <title>Ex5B - custom format for vector overlay</title>
        <script type="text/javascript" src="js/config.js"></script>
        <script type="text/javascript">
            var map;
            $(document).ready(function(){
                map = new OpenLayers.Map('map');
                osm = new OpenLayers.Layer.OSM("Simple OSM layer");
                map.addLayer(osm);

                $.ajax({
                    type: "GET",
                    url: "data/4capitals.txt",
                    dataType: "text",
                    success: createCustomOverlay
                });

                map.setCenter(new OpenLayers.LonLat(6, 46).transform("EPSG:4326", "EPSG:3857"), 5);
            });

            function createCustomOverlay(response) {
                // Créer/ajouter une nouvelle couche vide
                vectors = new OpenLayers.Layer.Vector("Custom vector overlay");
                map.addLayer(vectors);

                // Préparer un tableau pour accueillir des entités géographiques (des "features")
                features = new Array();

                // On décompose notre flux géographique encodé "maison"
                tabCapitals = response.split(",");
                for(i = 0; i < tabCapitals.length; i++){
                    tabCapital = tabCapitals[i].split(" ");

                    // on construit et ajoute au tableau une feature composé d'une géométrie (ici Point)
                    ptGeom = new OpenLayers.Geometry.Point(tabCapital[0],tabCapital[1]);
                    ptGeom = ptGeom.transform("EPSG:4326", "EPSG:3857");
                    // que le constructeur utilise pour alimenter la propriété feature.geometry
                    features[i] = new OpenLayers.Feature.Vector(ptGeom);
                    // et d'un tableau asssociatif feature.attributes pour chaque attribut à y associer (ici un seul, nom)
                    features[i].attributes.nom = tabCapital[2];
                }
                // le tableau est ajouté à la couche pour afficher les entités
                vectors.addFeatures(features);
            }
        </script>

        <style type="text/css">
            #map {
                width: 100%;
                height: 100%;
            }
        </style>
    </head>
    <body>
        <div id="map"></div>
    </body>
</html>
TODO
- Inspecter l'objet OpenLayers qui gère la persistence de ces entités géographiques côté client (ex. avec Firebug)
- Adapter le code pour une source de données similaire contenant un attribut de plus comme suit :
2.3332999999999999 48.866700000000002 Paris France,7.4333 46.950000000000003 Bern Suisse,12.5 41.883299999999998 Rome Italy,-3.71 40.409999999999997 Madrid Spain
- et réinspecter pour vérifier.
6. Style "vector"
OpenLayers met à disposition un Styling Framework permettant de configurer le moteur de rendu cartographique à appliquer sur une couche OpenLayers.Layer.Vector. Il offre de nombreux paramètres de style (voir Symbolizer properties).
Ex6A : Style d'entité
OpenLayers permet d'associer directement un style à une entité géographique OpenLayers.Feature.Vector.
<html>
    <head>
        <title>Ex6A - One feature, one style</title>
        <script type="text/javascript" src="js/config.js"></script>
        <script type="text/javascript">
            var map;
            $(document).ready(function() {
                map = new OpenLayers.Map('map');
                osm = new OpenLayers.Layer.OSM("Simple OSM layer");
                map.addLayer(osm);

                vectorLyr = new OpenLayers.Layer.Vector("Vector layer");
                map.addLayer(vectorLyr);

                feature = new OpenLayers.Feature.Vector();
                feature.geometry = new OpenLayers.Geometry.Point(738600, 5840171);
                feature.attributes = {
                    name: "The precious is here!",
                    author: "Gollum"
                };
                feature.style = {
                    graphicName: 'cross',
                    pointRadius: 10,
                    fillColor: '#ff0000',
                    fillOpacity: 0.8,
                    strokeColor: '#000000',
                    strokeWidth: 1
                };
                vectorLyr.addFeatures([feature]);
                map.setCenter(new OpenLayers.LonLat(738600, 5840171), 5);
            });
        </script>

        <style type="text/css">
            #map {
                width: 100%;
                height: 100%;
            }
        </style>
    </head>
    <body>
        <div id="map"></div>
    </body>
</html>
TODO
- Remplacer le style avec les propriétés suivantes :
        {
            externalGraphic: "http://www.cretasolaris.gr/gfx/marker.png",
            graphicWidth: 36,
            graphicHeight: 33,
            graphicOpacity: 1
        }
Ex6B : Style de couche
L'approche la plus répandue consiste à associer un style à une couche. Ce style est alors composé de règle cartographique et il est alors possible de configurer la représentation en contexte des données attributaires.
<html>
    <head>
        <title>Ex6B - One layer, one style</title>
        <script type="text/javascript" src="js/config.js"></script>
        <script type="text/javascript">
            var map;
            $(document).ready(function() {
                map = new OpenLayers.Map('map');
                osm = new OpenLayers.Layer.OSM("Simple OSM layer");
                map.addLayer(osm);

                ptSymbolizer = new OpenLayers.Symbolizer.Point({
                    externalGraphic: "http://www.cretasolaris.gr/gfx/marker.png",
                    graphicWidth: 36,
                    graphicHeight: 33,
                    graphicOpacity: 1
                });

                vectorLyr = new OpenLayers.Layer.Vector("Vector layer", {
                    styleMap: new OpenLayers.Style(ptSymbolizer)
                });
                map.addLayer(vectorLyr);

                feature = new OpenLayers.Feature.Vector();
                feature.geometry = new OpenLayers.Geometry.Point(738600, 5840171);
                feature.attributes = {
                    name: "The precious is here!",
                    author: "Gollum"
                };
                vectorLyr.addFeatures([feature]);
                map.setCenter(new OpenLayers.LonLat(738600, 5840171), 5);
            });
        </script>

        <style type="text/css">
            #map {
                width: 100%;
                height: 100%;
            }
        </style>
    </head>
    <body>
        <div id="map"></div>
    </body>
</html>
TODO
- Ajouter une entité géographique de plus comme suit :
feature = new OpenLayers.Feature.Vector(); feature.geometry = new OpenLayers.Geometry.Point(1938600, 6840171); feature.attributes = { name: "The hobbits are far away...", author: "Gandalf" }; vectorLyr.addFeatures([feature]); - Ajouter les propriétés de style suivantes (elles exploitent le contexte par une syntaxe de remplacement attributaire) :
label: "${name}, ${author}", labelYOffset: -30, fontColor: "red", fontSize: "20px" - Ajouter la couche vectorielle des 4 capitales et concocter un style pour les afficher avec une étiquette composée du nom de la ville et de sa population en 2003.
- Ajouter la couche GPX précédente et concocter un style manipulant les paramètres graphiques pour les lignes.
Ex6C : Style avancé : fonction de contexte
OpenLayers offre un outil puissant de rendu capable d'adapter une valeur de propriété de style selon le contexte de l'entité (géographique et attributaire). Il se base sur la syntaxe de remplacement attributaire vu ci-dessus.
<html>
    <head>
        <title>Ex6C - styling context function</title>
        <script type="text/javascript" src="js/config.js"></script>
        <script type="text/javascript">
            var map;
            $(document).ready(function() {
                OpenLayers.ProxyHost = myProxy;

                map = new OpenLayers.Map('map');
                osm = new OpenLayers.Layer.OSM("Simple OSM layer");
                map.addLayer(osm);

                ctxCategorize = {
                    getColor: function(feature) {
                        switch (feature.attributes["geo_region"]) {
                            case "Europe": noClass = 0; break;
                            case "Africa": noClass = 1; break;
                            default: noClass = 2;
                        }
                        colors = ["#ff0000", "#00ff00", "#0000ff"];
                        return colors[noClass];
                    }
                };

                ptSymbolizer = new OpenLayers.Symbolizer.Point({
                    graphicName: 'circle',
                    pointRadius: 5,
                    fillColor: '${getColor}'
                });

                capitals = new OpenLayers.Layer.Vector("WFS - cities (capitals)", {
                    protocol: new OpenLayers.Protocol.WFS({
                        url: myWFS,
                        featureType: "cities"
                    }),
                    strategies: [new OpenLayers.Strategy.Fixed()],
                    styleMap: new OpenLayers.Style(ptSymbolizer, {context: ctxCategorize})
                });
                map.addLayer(capitals);
                map.setCenter(new OpenLayers.LonLat(0, 0), 3);
            });
        </script>

        <style type="text/css">
            #map {
                width: 100%;
                height: 100%;
            }
        </style>
    </head>
    <body>
        <div id="map"></div>
    </body>
</html>
TODO
- Adapter le style pour représenter les capitales différemment des autres villes (exploiter l'attribut capit_1_0, valeur 1 = capitale).
- Adapter le style pour représenter les villes de l'hémisphère Sud différemment de celles de l'hémisphère Nord.
- Reprendre Ex5A avec le flux http://earthquake.usgs.gov/earthquakes/feed/v1.0/summary/2.5_day.geojson et un style basé sur une fonction de contexte pour représenter par classification l'intensité des séismes (exploiter l'attribut mag, voir aussi Echelle de Richter).
