GIS and Media fusion
"The explosive growth of the GeoWeb and geographic information has made GIS powerful media for the general public to communicate, but perhaps more importantly, GIS have also become media for constructive dialogs and interactions about social issues." - Sui & Goodchild
User Tools
This is an old revision of the document!
Table of Contents
Workshop OpenLayers (2017, part 1)
Dans OpenLayers (acronyme OL3, http://openlayers.org), une carte est un ensemble de couches associée à des contrôles pour gérer l'interaction avec l'utilisateur. Une carte se construit avec trois ingrédients de base : du balisage HTML, des déclarations de style CSS, et du code JavaScript.
Pour la suite, le point d'entrée pour se documenter sur l'utilisation de cette API est ici (en version 3.19.1 pour ce tutoriel) : (docs/API, examples, code). Aussi, profitez de cette présentation OL3 partagée par les collègues du département Géomatique.
1. Les éléments de base
- Pour ce workshop, télécharger le matériel de départ geoinf16-ol3.zip
- Décompresser l'archive dans un répertoire projet dans votre serveur web et découvrez le fichier js/config.js
- De nombreux exemples sont basés sur les géodonnées suivantes : cities.zip, world.zip
- Il est aussi nécessaire d'avoir les logiciels suivants fonctionnels (ou équivalents) : Firebug, REST Client
- (optionnel) Vous pouvez télécharger la librairie OL3 en local dans le répertoire lib depuis http://openlayers.org/download/
Ex1A : créer une carte, un premier exemple pour comprendre
<html>
    <head>
        <title>ol3 - Ex1A - Create a first map with an OGC WMS layer</title>
        <script type="text/javascript" src="js/config.js"></script>
        <script type="text/javascript">
            var map;
            $(document).ready(function () {
                map = new ol.Map({
                    target: 'map'
                });
                var wmsLayer = new ol.layer.Image({
                    source: new ol.source.ImageWMS({
                        url: blWMS,
                        ratio: 1,
                        params: {
                            VERSION: "1.0.0",
                            LAYERS: "ne_10m_admin_0_countries",
                            FORMAT: "image/png"
                        }
                    })
                });
                map.addLayer(wmsLayer);

                // Configuration of the map view
                var v0 = new ol.View({projection: "EPSG:4326"});
                var extent_init = [-18, 37, 38, 57]; // or v0.getProjection().getExtent();
                v0.fit(extent_init, map.getSize());
                map.setView(v0);
                showExtent(extent_init);
            });
        </script>
        <style type="text/css">
            #map {
                width: 100%;
                height: 100%;
            }
        </style>
    </head>
    <body>
        <div id="map"></div>
    </body>
</html>
Balisage HTML et déclarations CSS
- Le bloc <div> d'ID map est la cible de visualisation (la vue cartographique)
- C'est la position et la taille de cette div qui déterminent comment la vue s'intègre dans l'interface
- OpenLayers est accompagné de nombreuses prédéfinitions de déclarations CSS
Initialisation de la carte
- L'objet ol.Map est associé à l'ID de la cible de visualisation
- L'objet ol.View représente la vue 2D de la map. Il permet de définir le centre, la résolution et la rotation de la map
- L'objet ol.Layer est utilisé pour définir chaque couche à ajouter à la carte
- L'objet ol.source.ImageWMS permet de définir les paramètres d'une requête WMS pour obtenir une couche servie par un serveur cartographique conforme au standard OGC WMS (http://www.opengeospatial.org/standards/wms)
- La méthode fit termine l'initialisation en calculant l'enveloppe géographique de visualisation
TODO
- Repérez les déclarations qui habillent les boutons zoomin/zoomout et les ajuster pour que ces boutons ressemblent à ça

- Remplacer la configuration de la map view comme suit - quelle différence avec précédemment ?
var v2 = new ol.View({projection: "EPSG:4326"}); var cbox = [10, 47]; // NB: c'est le centre de l'extent_init ci-dessus v2.setCenter(cbox); v2.setZoom(5); map.setView(v2); - Remplacer la configuration de la map view comme suit - quelle différence avec précédemment ?
map.getView().setCenter(ol.proj.transform([10, 47], "EPSG:4326", "EPSG:3857"));
map.getView().setZoom(5);
- Redéfinir la couche wmsLayer comme suit - quelle différence en ajoutant une couche Tile plutôt que Image? :
var wmsLayer = new ol.layer.Tile({ source: new ol.source.TileWMS({ url: blWMS, ratio: 1, params: { VERSION: "1.0.0", LAYERS: "ne_10m_admin_0_countries", FORMAT: "image/png" } }) }); - Rechercher et tester d'autres couches de serveurs cartographiques WMS, comme par exemple celui de Swisstopo (voir config.js et http://spatialreference.org/ref/epsg/21781/)
2. Cache de tuiles
Avec une source ol.source.TileWMS c'est le client qui contrôle une grille de tuiles et il peut la garder en cache. Néanmoins, à chaque requête initiale de tuile, tout le processus de rendu cartographique se fait. Mais puisqu'une couche de tuiles fait des requêtes d'images selon une grille régulière, il est possible pour le serveur de préparer un cache de ces images.
Le service cartographique WMS permet une grande flexibilité en terme de ce que le client peut demander. Côté serveur, cela rend difficile la mise en cache. A l'extrême opposé, un service peut aussi offrir des tuiles pour un ensemble prédéfini de niveaux de zoom et pour une grille régulière prédéfinie. On parle de couches de tuiles avec une source XYZ - avec X et Y indiquant la colonne et la rangée de la grille et Z le niveau de zoom. Il faut voir cela comme une pyramide de tuiles.
Ex2A : ol.source.OSM
<html>
    <head>
        <title>ol3 - Ex2A - webmap with layer from tile server</title>
        <script type="text/javascript" src="js/config.js"></script>
        <script type="text/javascript">
            var map;
            $(document).ready(function(){
                map = new ol.Map({
                    target: 'map',
                    layers: [
                        new ol.layer.Tile({
                            source: new ol.source.OSM()
                        })
                    ]
                });
                map.getView().setCenter(ol.proj.transform([6.15,46.2],"EPSG:4326","EPSG:3857"));
                map.getView().setZoom(10);
            });
        </script>
        <style type="text/css">
            #map {
                width: 100%;
                height: 100%;
            }
        </style>
    </head>
    <body>
        <div id="map"></div>
    </body>
</html>
TODO
- Remplacer la source de la couche comme suit :
source: new ol.source.OSM({
 url:"http://api.tiles.mapbox.com/v3/oertz.map-i2ak2ozc/{z}/{x}/{y}.png",
 attributions: [
  new ol.Attribution({
   html: "Restyled & based on <a href='www.openstreetmap.org'>OpenStreetMap</a>"
  })
 ]
})
et ajouter l'instruction CSS suivante :
.ol-attribution {
  background-color: CornflowerBlue !important;
  right: 10px;
  left: initial;
  bottom: initial;
  top: 10px;
}
Remplacer la source ol.source.OSM par une source ol.source.XYZ comme suit :
source: new ol.source.XYZ({
  url: "http://urbangene.heig-vd.ch/tilecache/{z}/{x}/{y}.png"
})
Ex2B : ol.source.BingMaps
L'utilisation d'un cache serveur de tuiles a largement été popularisé par des services propriétaires comme Bing Maps. OpenLayers étant indépendant de toute source de données, l'API offre également un type de couche pour dialoguer avec de tels services.
TODO
- Partir de l'état initial de l'exemple précédent en adaptant le code JavaScript comme suit :
map = new ol.Map({ target: 'map', layers: [ new ol.layer.Tile({ source: new ol.source.BingMaps({ key: 'AqE05oJsq-bWa50FPOW2S0eQm9Oqqygc1VTi_WPhUIoKR_-jgA559CRbfndgWAIz', imagerySet: 'AerialWithLabels' }) }) ] }); map.getView().setCenter(ol.proj.transform([6.15,46.2],"EPSG:4326","EPSG:3857")); map.getView().setZoom(10); - Modifier le paramètre de type de couche selon la documentation Bing Maps (par exemple : 'OrdnanceSurvey'). Contrairement à un service WMS, le service de Bing Maps ne sait pas s'auto-décrire. Mais comme il n'y a qu'un seul service Bing Maps au monde, une documentation suffit.
- Pas de ol.source.GoogleMaps ? La réponse ici https://github.com/openlayers/ol3/issues/2205 et ici https://gist.github.com/elemoine/e82c7dd4b1d0ef45a9a4
Ex2C : OpenLayers.Layer.WMTS
Swisstopo offre un service de tuiles basé sur le standard WMTS et que l'on peut exploiter comme suit.
<html>
    <head>
        <title>ol3 - Ex2C - webmap with Swisstopo WMTS</title>
        <script type="text/javascript" src="js/config.js"></script>

        <script src="http://cdnjs.cloudflare.com/ajax/libs/proj4js/2.2.1/proj4.js"></script>
        <script src="http://epsg.io/21781.js"></script>

        <script type="text/javascript">
            var map;
            $(document).ready(function () {

                var projection = ol.proj.get('EPSG:21781');
                projection.setExtent([485869.5728, 76443.1884, 837076.5648, 299941.7864]);

                map = new ol.Map({
                    target: 'map',
                    view: new ol.View({
                        projection: ol.proj.get("EPSG:21781"),
                        center: [600000, 200000],
                        zoom: 6
                    })
                });

                var tileGrid = new ol.tilegrid.WMTS({
                    origin: [420000, 350000],
                    resolutions: [4000, 3750, 3500, 3250, 3000, 2750, 2500, 2250, 2000, 1750, 1500, 1250, 1000, 750, 650, 500, 250, 100, 50, 20, 10, 5, 2.5, 2, 1.5, 1, 0.5],
                    matrixIds: [0, 1, 2, 3, 4, 5, 6, 7, 8, 9, 10, 11, 12, 13, 14, 15, 16, 17, 18, 19, 20, 21, 22, 23, 24, 25, 26]
                });

                var layer = new ol.layer.Tile({
                    source: new ol.source.WMTS(({
                        url: "http://wmts.geo.admin.ch/1.0.0/{Layer}/default/20140520/21781/{TileMatrix}/{TileRow}/{TileCol}.jpeg",
                        tileGrid: tileGrid,
                        layer: "ch.swisstopo.pixelkarte-farbe",
                        requestEncoding: 'REST'
                    }))
                });
                map.addLayer(layer);
                console.log(map.getView().getProjection().getCode());
            });

        </script>
        <style type="text/css">
            #map {
                width: 100%;
                height: 100%;
            }
        </style>
    </head>
    <body>
        <div id="map"></div>
    </body>
</html>
TODO
- Ajouter l'instruction suivante :
navigator.geolocation.getCurrentPosition(locationFixed, locationError);
ainsi que les deux fonctions callback qui vont avec :
function locationFixed(position) { map.getView().setCenter(ol.proj.transform([position.coords.longitude, position.coords.latitude],"EPSG:4326","EPSG:21781")); } function locationError(e) { console.log(e); } - Intéressant pour aider à démystifier le fonctionnement et l'utilisation de l'HTML5 Geolocation API :
- Géolocalisation en HTML5 – màj 2017
- HTML5 Geolocation API – how accurate is it, really? – un peu ancien (2012/2013)
- MMA Location Terminology Guide – ~2015
- Souriez, vous êtes géolocalisés ! – NG 2016

- Utilisation d'un service de géolocalisation :
- Open, crowdsourced : Mozilla Location Service (MLS)
- Avec la Google Maps Geolocation API, dans un client type RESTClient
- configurer une requête POST → https://www.googleapis.com/geolocation/v1/geolocate?key=AIzaSyBpYS569CJN6A7wbDUXokxOJAbQhBokDkc
- lancer la requête avec le corps suivant - quel est ce lieu ?
{
  "considerIp": "false",
  "wifiAccessPoints": [
    {
        "macAddress": "00:25:9c:cf:1c:ac"
    },
    {
        "macAddress": "00:25:9c:cf:1c:ad"
    }
  ]
}
3. Style de couche "image"
Pour l'édition 2017, optionnel (remplacé par le suffisant Ex4E).
Sinon voir :
4. Composition de couches
Ex4A : Composition "server-side"
Dans la section précédente, la composition de couches est pilotée “une fois pour toute” côté serveur. Ci-dessous un pilotage de la composition “à la demande” côté client (et donc plus il y a de couches disponibles sur le serveur cartographique, plus il y a de combinaisons possibles).
<html>
    <head>
        <title>ol3 - Ex4A - one WMS request for two layers</title>
        <script type="text/javascript" src="js/config.js"></script>
        <script type="text/javascript">
            var map;
            $(document).ready(function(){
                map = new ol.Map({
                    target: 'map',
                    layers: [
                        new ol.layer.Image({
                            source: new ol.source.ImageWMS({
                                    url: mcWMS,
                                    params:{
                                        VERSION: "1.1.1",
                                        LAYERS: 'public.world_simple,public.cities',
                                        FORMAT: 'image/png'
                                }
                            }),
                        })
                    ]
                });
                // default view is used here, that is with the Mercator EPSG:3857 projection
                map.getView().setCenter(ol.proj.transform([7, 47],"EPSG:4326","EPSG:3857"))
                map.getView().setZoom(5);
            });
        </script>

        <style type="text/css">
            #map {
                width: 100%;
                height: 100%;
            }
        </style>
    </head>
    <body>
        <div id="map"></div>
    </body>
</html>
TODO
- Vérifier que la composition est bien faite côté serveur.
- Quel intérêt à utiliser cette technique ? Quels inconvénients ? Utilise-t-on tout le potentiel d'un client navigateur pour faciliter la composition “à la demande” par l'utilisateur ?
Ex4B : Composition "client-side"
Une application de cartographie en ligne se doit de permettre à l'utilisateur de personnaliser sa carte par ses choix pour la couche de référence (baselayer) et les couches à activer en superposition (overlays). Elle doit fournir la capacité de gérer la composition côté client.
<html>
    <head>
        <title>ol3 - Ex4B - two WMS overlayed layers</title>
        <script type="text/javascript" src="js/config.js"></script>
        <script type="text/javascript">
            var map;
            $(document).ready(function () {
                map = new ol.Map({
                    target: 'map',
                    layers: [
                        new ol.layer.Image({
                            title: 'World simple',
                            source: new ol.source.ImageWMS({
                                url: mcWMS,
                                params: {
                                    VERSION: "1.1.1",
                                    LAYERS: 'public.world_simple',
                                    FORMAT: 'image/png'
                                }
                            })
                        }),
                        new ol.layer.Image({
                            title: 'Cities',
                            source: new ol.source.ImageWMS({
                                url: mcWMS,
                                params: {
                                    VERSION: "1.1.1",
                                    LAYERS: 'public.cities',
                                    FORMAT: 'image/png'
                                }
                            })
                        })
                    ]
                });
                map.getView().setCenter(ol.proj.transform([7, 47], "EPSG:4326", "EPSG:3857"))
                map.getView().setZoom(5);
            });
        </script>

        <style type="text/css">
            #map {
                width: 100%;
                height: 100%;
            }
        </style>
    </head>
    <body>
        <div id="map"></div>
    </body>
</html>
TODO
- Apporter la preuve que l'assemblage s'est fait côté client.
- Analyser les paramètres WMS. Lequel représente l'indispensable capacité “server-side” pour permettre l'assemblage client-side par superposition ?
- Ajouter dans la table des couches les ne_10m_admin_0_countries et ne_10m_lakes du GeoServer de Boundless (blWMS) comme suit :
new ol.layer.Image({
    title: "Countries",
    source: new ol.source.ImageWMS({
        url: blWMS,
        params: {
            VERSION: "1.0.0",
            LAYERS: "ne_10m_admin_0_countries",
            FORMAT: "image/png"
        }
    })
}),
new ol.layer.Image({
    title: "Lakes",
    source: new ol.source.ImageWMS({
        url: blWMS,
        params: {
            VERSION: "1.0.0",
            LAYERS: "ne_10m_lakes",
            FORMAT: "image/png"
        }
    })
})
Visualiser le résultat. Qu'est-ce qui est “baselayer”, qu'est-ce qui est “overlays” ?
- Remettre un peu d'ordre là où c'est possible.
Ex4C : Gestion de composition cartographique - LayerSwitcher
OL3 n'offre pour l'instant pas nativement de “UI manager” de composition cartographique. Néanmoins l'API offre ce qu'il faut pour concevoir son propre LayerSwitcher.
<html>
    <head>
        <title>ol3 - Ex4C - MyLayerSwitcher</title>
        <script type="text/javascript" src="js/config.js"></script>
        <script type="text/javascript">
            var map, lyrs;
            $(document).ready(function () {
                map = new ol.Map({
                    target: 'map',
                    layers: [
                        new ol.layer.Image({
                            source: new ol.source.ImageWMS({
                                url: blWMS,
                                params: {
                                    VERSION: "1.0.0",
                                    LAYERS: "ne_10m_admin_0_countries",
                                    FORMAT: "image/png"
                                }
                            }),
                        }),
                        new ol.layer.Image({
                            source: new ol.source.ImageWMS({
                                url: mcWMS,
                                params: {
                                    VERSION: "1.1.1",
                                    LAYERS: 'public.world_simple',
                                    FORMAT: 'image/png'
                                }
                            })
                        }),
                        new ol.layer.Image({
                            source: new ol.source.ImageWMS({
                                url: blWMS,
                                params: {
                                    VERSION: "1.0.0",
                                    LAYERS: "ne_10m_lakes",
                                    FORMAT: "image/png"
                                }
                            }),
                        }),
                        new ol.layer.Image({
                            source: new ol.source.ImageWMS({
                                url: mcWMS,
                                params: {
                                    VERSION: "1.1.1",
                                    LAYERS: 'public.cities',
                                    FORMAT: 'image/png'
                                }
                            })
                        })
                    ]
                });
                map.getView().setCenter(ol.proj.transform([7, 47], "EPSG:4326", "EPSG:3857"))
                map.getView().setZoom(5);

                initMyLayerSwitcher();
            });

            /***
             * initMyLayerSwitcher: a first attempt to manage baselayers and overlayers.
             *
             * Remark: in the current state, the main drawback is that it is absolutly
             * not flexible and adaptative!
             *
             * @returns {undefined}
             */
            function initMyLayerSwitcher(){
                lyrs = map.getLayers().getArray();

                // Set visibility of the baselayer
                lyrs[0].setVisible(true);
                lyrs[1].setVisible(false);

                // Set visibility of the overlays
                lyrs[2].setVisible(false);
                lyrs[3].setVisible(false);
                $('#overlay option').prop('selected', false);

                // Define the callback when the user does change the baselayer
                $("#base").change(function (e) {
                    // Reset all baselayers
                    lyrs[0].setVisible(false);
                    lyrs[1].setVisible(false);

                    // Activate the one that is selected (based on index)
                    var idxVisible = $(this).find(":selected").index();
                    lyrs[idxVisible].setVisible(true);
                });

                // Define the callback when the user does change the overlays
                $("#overlay").change(function (e) {
                    $(this).find("option").each(function (i, e) {
                        // i + 2 because the 1st and 2nd elements in the table of layers are the baselayers
                        lyrs[i + 2].setVisible(e.selected);
                    });
                });
            }
        </script>

        <style type="text/css">
            #map {
                width: 80%;
                height: 100%;
            }
            #switcher {
                position: absolute;
                left: 82%;
                top: 2%;
            }
        </style>
    </head>
    <body>
        <div id="map"></div>

        <div id="switcher">
            <p>Choose baselayer:</p>
            <select id="base">
                <option value="base1">Countries</option>
                <option value="base2">World simple</option>
            </select>
            <p>Choose overlays:</p>
            <select id="overlay" size="2" multiple>
                <option value="overlay1">Lakes</option>
                <option value="overlay2">Cities</option>
            </select>
        </div>
    </body>
</html>
TODO
- Analyser le code ci-dessus et identifier la principale capacité “client-side” de l'API sur laquelle repose ce LayerSwitcher.
- Adapter le code pour ajouter à l'équation la couche OSM suivante :
new ol.layer.Tile({ source: new ol.source.OSM() }) - Ajouter la propriété ci-dessous à la couche des lacs
opacity: 0.5
Ex4D : Un contrôle LayerSwitcher plus souple
A partir des capacités offertes par l'API, la communauté de développeurs gravitant autour du core OL3 développe des controls parmi lesquels un LayerSwitcher un peu plus malin.
<html>
    <head>
        <title>ol3 - Ex4D - A clever LayerSwitcher</title>
        <script type="text/javascript" src="js/config.js"></script>

        <link rel="stylesheet" href="lib/layerswitcher/ol3-layerswitcher.css" type="text/css">
        <script src="lib/layerswitcher/ol3-layerswitcher.js" type="text/javascript"></script>

        <script type="text/javascript">
            var map, lyrs;
            $(document).ready(function () {
                map = new ol.Map({
                    target: 'map',
                    layers: [
                        new ol.layer.Image({
                            title: "Countries",
                            type: "base",
                            source: new ol.source.ImageWMS({
                                url: blWMS,
                                params: {
                                    VERSION: "1.0.0",
                                    LAYERS: "ne_10m_admin_0_countries",
                                    FORMAT: "image/png"
                                }
                            }),
                        }),
                        new ol.layer.Image({
                            title: 'World simple',
                            type: "base",
                            source: new ol.source.ImageWMS({
                                url: mcWMS,
                                params: {
                                    VERSION: "1.1.1",
                                    LAYERS: 'public.world_simple',
                                    FORMAT: 'image/png'
                                }
                            })
                        }),
                        new ol.layer.Image({
                            title: "Lakes",
                            source: new ol.source.ImageWMS({
                                url: blWMS,
                                params: {
                                    VERSION: "1.0.0",
                                    LAYERS: "ne_10m_lakes",
                                    FORMAT: "image/png"
                                }
                            }),
                        }),
                        new ol.layer.Image({
                            title: 'Cities',
                            source: new ol.source.ImageWMS({
                                url: mcWMS,
                                params: {
                                    VERSION: "1.1.1",
                                    LAYERS: 'public.cities',
                                    FORMAT: 'image/png'
                                }
                            })
                        })
                    ]
                });
                map.getView().setCenter(ol.proj.transform([7, 47], "EPSG:4326", "EPSG:3857"))
                map.getView().setZoom(5);

                var layerSwitcher = new ol.control.LayerSwitcher();
                map.addControl(layerSwitcher);
            });
        </script>

        <style type="text/css">
            #map {
                width: 80%;
                height: 100%;
            }
        </style>
    </head>
    <body>
        <div id="map"></div>
    </body>
</html>
TODO N°1
- Comment fonctionne ce ol3-layerswitcher ? (remarquez quelques nouvelles propriétés intéressantes sur ol.layer).
- Ajouter une baselayer sur un base Bing Maps comme vu à l'Ex2B (ex. Aerial)
- Ajouter un overlay basé sur la couche ch.swisstopo.pixelkarte-pk25.metadata-kartenblatt servie par le serveur WMS http://wms.geo.admin.ch de Swisstopo (chWMS, voir aussi la doc GeoAdmin)
Illustration du résultat attendu :

TODO N°2
(NB les prérequis spécifiques : Ex3A et Ex3B)
- Utiliser la couche WMS world_simple en overlay en ne visualisant que les frontières des pays (pas de remplissage des zones).
- Ajouter une baselayer MapBox comme celle avec le mapID mapbox.pencil (voir https://www.mapbox.com/developers/api/maps/#mapids)
- Ajouter un overlay basé sur une couche MapBox de votre cru notamment avec le 3e exercice du tutoriel MapBox/CartoCSS (voir Ex3B, avec votre couche g4cantons)
Ex4E : Pilotage de style par le client (CartoCSS)
Jusqu'à présent, c'est le serveur qui fait tourner son moteur cartographique pour créer une représentation image des données géographiques et ceci sur la base de styles prédéfinis (ex. avec le langage SLD dans GeoServer). Voyons comment le client peut dire son mot et piloter le style “à distance”.
Etape 1 : découverte d'une intéressante plateforme cartographique, CARTO (aka CartoDB) et du langage CartoCSS.
- naviguer vers https://oertz.carto.com/me
- choisir le dataset geoinf_contour_yverdon (fabriqué avec QGIS à partir du MNT N46E006.hgt, Modèle Numérique de Terrain)
- choisir “Create a map” (le cas échéant créer un compte)
- renommer la carte “Jouons avec CARTO!”
- cartodb_query – c'est le dataset sous-jacent qui a été importé dans votre espace CARTO - utiliser le sélecteur MAP/DATA
- renommer la layer “contour_yverdon_label” et éditer le style pour afficher les altitudes sur les lignes de contour
- l'UI Style Editor est pratique et on peut affiner la description de style en accédant aux instructions CartoCSS - utiliser le sélecteur VALUES/CARTOCSS
Etape 2 : intégration dans notre application OL3 (voir l'application ci-dessous)
- l'application charge l'API CORE JavaScript de CARTO (cf. https://carto.com/docs/carto-engine/carto-js/core-api/)
- la méthode cartodb.Tiles.getTiles permet d'assembler un dataset sélectionné (sublayers/sql) avec un style donné (sublayers/cartocss) - NB aussi le user_name
- le callback construit l'URL qui correspond à votre cache source de tuiles (ex. a.ashbu.cartocdn.com/ogo/api/v1/map/4c64e8d931417377282738/{z}/{x}/{y}.png)
- l'URL est utilisée pour créer une couche ol.layer.Tile sur la base de cette source tuilée avec l'habituel ol.source.XYZ
<html>
    <head>
        <title>ol3 - Ex4E - On demand CartoCSS</title>
        <script type="text/javascript" src="js/config.js"></script>

        <script src="http://libs.cartocdn.com/cartodb.js/v3/3.11/cartodb.core.js"></script>

        <script type="text/javascript">
            var map;
            $(document).ready(function () {
                map = new ol.Map({
                    view: new ol.View({
                        center: ol.proj.transform([6.45, 46.7], 'EPSG:4326', 'EPSG:3857'),
                        zoom: 14
                    }),
                    target: 'map',
                    layers: [
                        new ol.layer.Tile({
                            source: new ol.source.OSM()
                        })
                    ]
                });

                cartodb.Tiles.getTiles({
                    type: 'cartodb', user_name: 'oertz', sublayers: [{
                            sql: 'SELECT * FROM geoinf_contour_yverdon',
                            cartocss: "#geoinf_contour_yverdon{line-color:#FF6600;line-width:2;line-opacity:0.7;}"
                        }]
                }, function (tileTemplate) { // create layer with generated tiles URL
                    tilesUrl = tileTemplate.tiles[0]
                            .replace('{s}', 'a')
                            .replace('{z}', '{z}')
                            .replace('{x}', '{x}')
                            .replace('{y}', '{y}');

                    console.log(tilesUrl);

                    admLyr = new ol.layer.Tile({
                        source: new ol.source.XYZ({
                            url: tilesUrl
                        })
                    })
                    map.addLayer(admLyr);
                });
            });
        </script>

        <style type="text/css">
            #map {
                width: 100%;
                height: 100%;
            }
        </style>
    </head>
    <body>
        <div id="map"></div>
    </body>
</html>
TODO A
- Adapter l'application avec les instructions CartoCSS préparées ci-dessus pour afficher les altitudes sur les lignes de contour, uniquement pour les altitudes supérieures à 800m (voir aussi Custom basemap tiles with CartoCSS, J. Freyre, 2014)
- Ajouter une couche ol.layer.Tile à partir du dataset des districts de Suisse https://ogo.cartodb.com/tables/g4districts98/public et en construisant un style qui affiche les districts Vaudois différemment des autres (NB : selon votre goût, et dézoomer un peu pour y voir)
- Adapter l'application pour que le style CartoCSS soit chargé asynchronnement depuis un fichier myGreatRemoteStyle.mss (on proclame le suffixe mss pour Map Style Sheet).
Résultat
http://www.mediamaps.ch/oltuto/Ex4C_0.html
http://www.mediamaps.ch/oltuto/Ex4E_2.html
TODO B
Quelles similitudes et différences entre l'approche précédente et celle-ci, qui peut se résumer à une requête :
https://wms.geo.admin.ch/?SERVICE=WMS&VERSION=1.0.0&REQUEST=GetMap&FORMAT=image/png&LAYERS=ch.swisstopo.pixelkarte-pk25.metadata-kartenblatt&SRS=EPSG:3857&STYLES=&WIDTH=2285&HEIGHT=897&BBOX=174582,5648084,1571851,6196597&SLD=https://drive.switch.ch/index.php/s/brNwxHVjcBeZVDc/download
5. Couche "vector"
Dans les sections précédentes nous avons inséré des couches cartographiques sous la forme d'images construites par le serveur avec son moteur cartographique. Un serveur cartographique était donc nécessaire. A l'opposé, pour une couche ol.layer.Vector c'est le client qui joue le rôle de moteur cartographique pour créer la visualisation d'entités géographiques (Features en anglais).
- Télécharger l'archive data.zip et la déployer dans votre dossier de projet web.
Ex5A : Source de données OpenLayers.Format
Une couche ol.layer.Vector peut être alimentée par une source de données au format ol.source.GeoJSON (voir aussi http://geojson.org). Il existe de nombreux autres formats : ol.format.GPX, ol.format.TopoJSON, ol.format.KML, sans oublier le Geographic Markup Language (ol.format.GML) de l'OGC qui “consiste en un ensemble de schémas XML qui permettent de construire des modèles de données pour des domaines métiers spécifiques (urbanisme, hydrologie, géologie, …) et définissent un format ouvert pour l'échange de données géographiques” (source Wikipedia). Voir l'exemple dans votre dossier data : ./data/fourCapitals.gml
<html>
    <head>
        <title>ol3 - Ex5A - GeoJSON vector overlay</title>
        <script type="text/javascript" src="js/config.js"></script>
        <script type="text/javascript">
            var map;
            $(document).ready(function(){
                map = new ol.Map({
                    view: new ol.View({
                        center:[738600, 5840171],
                        zoom: 3
                    }),
                    target: 'map',
                    layers: [
                        new ol.layer.Tile({
                            source: new ol.source.OSM()
                        })
                    ]
                });
                vectorLayer = new ol.layer.Vector({
                    source: new ol.source.Vector({
                        url: "data/4capitals.json",
                        format: new ol.format.GeoJSON()
                    })
                });
                map.addLayer(vectorLayer);
            });
        </script>

        <style type="text/css">
            #map {
                width: 100%;
                height: 100%;
            }
        </style>
    </head>
    <body>
        <div id="map"></div>
    </body>
</html>
TODO
- Apporter la preuve que les données sont bien transformées en objets graphiques côté client !
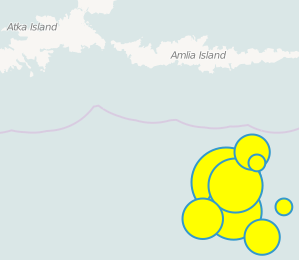
- Qu'est-ce-que ce format GeoJSON http://geojson.org ? Remplacer l'URL source par
https://earthquake.usgs.gov/earthquakes/feed/v1.0/summary/2.5_day.geojson
en dézoomant un peu le cas échéant.
- Ajouter une interaction utilisateur (ex. bouton) qui affiche (ex. dans une div HTML) la liste des descriptions des séismes (propriété title). Ces informations sont bien sûr associées aux entités rattachées à la classe ol.layer.Vector.
Illustration du résultat attendu :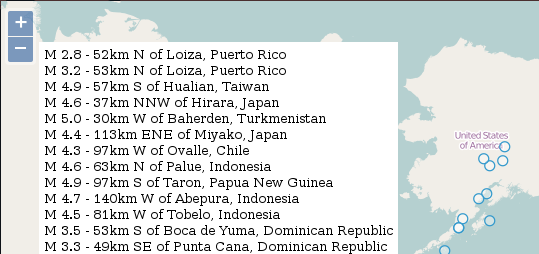
- Enlever l'interaction et modifier l'url comme suit et modifier le type de source de données en conséquence:
url: 'https://drive.switch.ch/index.php/s/ISW7xzNmVTAkwQM/download',
format: new ol.format.GPX()
en recentrant la carte par ici :
view: new ol.View({
  center:[766225, 5908730],
  zoom: 12
}),
Pourquoi cela ne fonctionne pas ? Et pourquoi ça fonctionnait alors avant avec le flux GeoJSON des séismes ?
Ex5B : ol.source.Vector sous la loupe
Cette section décrit en détail ce qu'est une source de donnée ol.source.Vector pour une couche ol.layer.Vector en montrant comment la créer et l'alimenter à partir d'un format de source de géodonnées “fait maison”. En résumé, une source ol.source.Vector est composée d'entités géographiques (ol.Feature) chacune composée d'une géométrie (ol.geom) et d'une liste d'attributs.
La source de données est un fichier texte formaté comme suit:
2.3332999999999999 48.866700000000002 Paris,7.4333 46.950000000000003 Bern,12.5 41.883299999999998 Rome,-3.71 40.409999999999997 Madrid
La structure de formatage est simple : c'est une suite de triplets “Longitude Latitude Nom” dont le séparateur interne est l'espace. Le séparateur entre triplets est la virgule. Chaque triplet correspond à une entité géographique. Le code ci-dessous décode cette structure et transforme les triplets en objects de type ol.Feature.
<html>
    <head>
        <title>ol3 - Ex5B - custom format for vector overlay</title>
        <script type="text/javascript" src="js/config.js"></script>
        <script type="text/javascript">
            var map;
            $(document).ready(function () {
                map = new ol.Map({
                    view: new ol.View({
                        center: ol.proj.transform([2, 48], 'EPSG:4326', 'EPSG:3857'),
                        zoom: 5
                    }),
                    target: 'map',
                    layers: [
                        new ol.layer.Tile({
                            source: new ol.source.OSM(),
                            opacity: 0.3
                        }),
                    ]
                });
                $.get("data/4capitals.txt", createCustomOverlay);
            });

            function createCustomOverlay(response) {
                // Create/add a new empty vector layer
                vectors = new ol.layer.Vector({
                    source: new ol.source.Vector()
                });
                map.addLayer(vectors);
                // Declare an empty array ready to receive some features
                features = new Array();
                // Lets's decode the "home made" format
                tabCapitals = response.split(",");
                for (i = 0; i < tabCapitals.length; i++) {
                    tabCapital = tabCapitals[i].split(" ");
                    // Create a feature built of a geometry (a Point in our case) and a property (name)
                    var feature = new ol.Feature({
                        geometry: new ol.geom.Point(ol.proj.transform([parseFloat(tabCapital[0]), parseFloat(tabCapital[1])], 'EPSG:4326', 'EPSG:3857')),
                        name: tabCapital[2]
                    });
                    // Add the feature created to the array of features
                    features.push(feature);
                }
                // Add the set of features to the ol.source.Vector which is in relation to the ol.layer.Vector
                vectors.getSource().addFeatures(features);
            }
        </script>

        <style type="text/css">
            #map {
                width: 100%;
                height: 100%;
            }
        </style>
    </head>
    <body>
        <div id="map"></div>
    </body>
</html>
TODO
- Adapter le code pour une source de données similaire contenant un attribut de plus comme suit :
2.3332999999999999 48.866700000000002 Paris France,7.4333 46.950000000000003 Bern Suisse,12.5 41.883299999999998 Rome Italy,-3.71 40.409999999999997 Madrid Spain
- Montrer que l'attribut a bien été pris en compte (par exemple en créant une interaction similaire à celle demandée dans l'Ex5A, avec une liste de descriptions des entités).
6. Style "vector"
OpenLayers met à disposition un ensemble de classes ol.style permettant d'appliquer des styles aux features (entités géographiques) d'une couche ol.vector.
Ex6A : Style d'entité
Openlayers applique un style par défaut aux features, mais il est possible de redéfinir ce style (forme, couleur, etc.).
<html>
    <head>
        <title>ol3 - Ex6A - One feature, one style</title>
        <script type="text/javascript" src="js/config.js"></script>
        <script type="text/javascript">
            var map;
            $(document).ready(function () {
                map = new ol.Map({
                    view: new ol.View({
                        center: [750393, 5862618],
                        zoom: 15
                    }),
                    target: 'map',
                    layers: [
                        new ol.layer.Tile({
                            source: new ol.source.OSM()
                        })
                    ]
                });

                vectLayer = new ol.layer.Vector({
                    source: new ol.source.Vector()
                });
                map.addLayer(vectLayer);

                // Prepare a stroke style
                var redStroke = new ol.style.Stroke({
                    color: '#ff0000',
                    width: 3
                });

                var style = new ol.style.Style({
                    image: new ol.style.RegularShape({
                        points: 4,
                        stroke: redStroke,
                        radius: 10,
                        radius1: 0,
                        radius2: 0
                    })
                });

                // Create and style a feature
                var feature = new ol.Feature({
                    geometry: new ol.geom.Point([750393, 5862618])
                });
                feature.setStyle(style);
                vectLayer.getSource().addFeature(feature);
            });
        </script>

        <style type="text/css">
            #map {
                width: 100%;
                height: 100%;
            }
        </style>
    </head>
    <body>
        <div id="map"></div>
    </body>
</html>
TODO
- Remplacer le style avec les propriétés suivantes :
var style =  new ol.style.Style({
    image: new ol.style.Icon({
        src: "http://urbangene.heig-vd.ch/css/img/icones/marker_saved.png"
    })
});
… c'est très joli, mais il semble qu'il y ait un problème ! Lequel ? Comment le résoudre ? → docs/API
- Ajouter une entité de plus dans la source - que constate-t-on ?
var feature2 = new ol.Feature({ geometry: new ol.geom.Point([759116, 5860375]) }); vectLayer.getSource().addFeature(feature2); - Créer une entité de type LineString en remplaçant la propriété geometry comme suit et avec une représentation en ligne traitillé :
geometry: new ol.geom.LineString([[750393, 5862618],[759116, 5860375]])
Ex6B : Style de couche
L'approche la plus répandue consiste à associer un style à une couche, c'est-à-dire qu'il s'applique automatiquement à toutes les entités de la couche (comme avec SLD/SE et CartoCSS).
<html>
    <head>
        <title>ol3 - Ex6B - One layer, one style</title>
        <script type="text/javascript" src="js/config.js"></script>
        <script type="text/javascript">
            var map;
            $(document).ready(function () {

                var fill = new ol.style.Fill({
                    color: '#acc000'
                });
                var stroke = new ol.style.Stroke({
                    color: '#ff0000',
                    width: 3
                });
                var style = new ol.style.Style({
                    image: new ol.style.Icon({
                        src: "http://urbangene.heig-vd.ch/css/img/icones/marker_saved.png",
                        anchor: [0.5, 1]
                    })
                });

                map = new ol.Map({
                    view: new ol.View({
                        center: ol.proj.transform([2, 48], 'EPSG:4326', 'EPSG:3857'),
                        zoom: 5
                    }),
                    target: 'map',
                    layers: [
                        new ol.layer.Tile({
                            source: new ol.source.OSM()
                        })
                    ]
                });

                vecLayer = new ol.layer.Vector({
                    source: new ol.source.Vector({})
                });
                vecLayer.setStyle(style);

                var feature1 = new ol.Feature({
                    geometry: new ol.geom.Point([738600, 5840171]),
                    name: "The precious is here!",
                    author: "Gollum"
                });
                map.addLayer(vecLayer);
                vecLayer.getSource().addFeature(feature1);
            });
        </script>

        <style type="text/css">
            #map {
                width: 100%;
                height: 100%;
            }
        </style>
    </head>
    <body>
        <div id="map"></div>
    </body>
</html>
TODO
- Ajouter une entité géographique de plus comme suit :
var feature2 = new ol.Feature({ geometry: new ol.geom.Point([1938600, 6840171]), name: "The hobbits are far away...", author: "Gandalf" }); vecLayer.getSource().addFeature(feature2); - Modifier la feature1 et la feature2 avec les deux LineString ci-dessous :
var feature1 = new ol.Feature({
    geometry: new ol.geom.LineString([[738600, 6840171],[1938600, 6840171]])
});

var feature2 = new ol.Feature({
    geometry: new ol.geom.LineString([[738600, 5840171],[1938600, 7840171]])
});
Adapter la représentation des lignes avec un style highway comme illustré ci-après :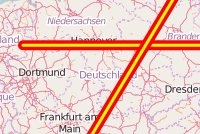
Ex6C : Fonction de style
Plutôt que d'appliquer un style identique à toutes les entités d'une couche, il est possible d'appliquer un style différents basé sur les propriétés de chacune des entités. Pour cela, Openlayers propose de remplacer l'objet ol.style.Style par une fonction ol.style.StyleFunction(). Dans l'exemple ci-dessous on affiche une étiquette différente en fonction de la propriété “name” de chaque entité.
<html>
    <head>
        <title>ol3 - Ex6C - Styling function</title>
        <script type="text/javascript" src="js/config.js"></script>
        <script type="text/javascript">
            var map;
            $(document).ready(function () {

                var icon = new ol.style.Icon({
                    src: "http://urbangene.heig-vd.ch/css/img/icones/marker_saved.png",
                    anchor: [0.5, 1]
                });

                function createLordStyle(feature, resolution) {
                    var style = new ol.style.Style({
                        image: icon,
                        text: new ol.style.Text({
                            text: feature.get('name'),
                            offsetY: 25,
                            font: '18px Calibri,sans-serif',
                            fill: new ol.style.Fill({
                                color: "#000"
                            })
                        })
                    })
                    return [style];
                }
                ;

                map = new ol.Map({
                    view: new ol.View({
                        center: ol.proj.transform([2, 48], 'EPSG:4326', 'EPSG:3857'),
                        zoom: 5
                    }),
                    target: 'map',
                    layers: [
                        new ol.layer.Tile({
                            source: new ol.source.OSM()
                        })
                    ]
                });

                vecLayer = new ol.layer.Vector({
                    source: new ol.source.Vector(),
                    style: createLordStyle
                });

                var feature = new ol.Feature({
                    geometry: new ol.geom.Point([738600, 5840171]),
                    name: "The precious is here!",
                    author: "Gollum"
                });
                map.addLayer(vecLayer);

                var feature2 = new ol.Feature({
                    geometry: new ol.geom.Point([1938600, 6840171]),
                    name: "The hobbits are far away...",
                    author: "Gandalf"
                });
                vecLayer.getSource().addFeatures([feature, feature2]);

            });
        </script>

        <style type="text/css">
            #map {
                width: 100%;
                height: 100%;
            }
        </style>
    </head>
    <body>
        <div id="map"></div>
    </body>
</html>
TODO
- Modifier ce qu'il faut pour visualiser des étiquettes comme suit Gollum says: The precious is here! et Gandalf says: The hobbits are far away…
- Ajouter une couche vector utilisant le flux https://earthquake.usgs.gov/earthquakes/feed/v1.0/summary/2.5_day.geojson (cf Ex5A) et faire en sorte que les points séismes soient représentés différemment dans chaque hémisphère.
- Sur la base de ce même flux, proposer une représentation thématique des points séismes en exploitant leur propriété d'intensité/magnitude (voir l'attribut
mag, voir aussi Echelle de Richter).
En quoi le paramètrerenderOrderde ol.layer.Vector est ici particulièrement intéressant ?