GIS and Media fusion
"The explosive growth of the GeoWeb and geographic information has made GIS powerful media for the general public to communicate, but perhaps more importantly, GIS have also become media for constructive dialogs and interactions about social issues." - Sui & Goodchild
User Tools
This is an old revision of the document!
Table of Contents
Workshop OpenLayers (2017, part 2)
7. Contrôles et interactions
OpenLayers offre un ensemble de fonctionnalités permettant d'interagir avec la carte. Par défaut, les interactions de zoom et pan sont actives mais il en existe d'autres (ol.control). En plus de la gestion événementielle offerte par ces contrôleurs, OpenLayers permet d'enregistrer des écouteurs sur de nombreux événements. Maintenant que les techniques de visualisation cartographique sont maîtrisées, tant côté serveur que client, il s'agit de découvrir comment interagir avec la carte, ses couches et les objets géographiques représentés.
Ex7A : découverte de la gestion événementielle cartographique
Cet exemple démontre qu'il est nécessaire qu'un gestionnaire s'occupe spécifiquement d'évenements cartographiques comme ceux en lien avec la vie d'un ol.Map (voir ol.MapBrowserEvents) ou ceux relatifs à la vie d'une ol.layer.Vector, d'une ol.source.Vector, etc.
On reprend ici l'exemple 5A :
<html>
    <head>
        <title>ol3 - Ex7A - ol.ObjectEvent</title>
        <script type="text/javascript" src="js/config.js"></script>
        <script type="text/javascript">
            var map, vectorLayer;

            $(document).ready(function () {
                map = new ol.Map({
                    view: new ol.View({
                        center: [0, 0],
                        zoom: 2
                    }),
                    target: 'map',
                    layers: [
                        new ol.layer.Tile({
                            opacity: 0.5, // !!
                            source: new ol.source.OSM()
                        })
                    ]
                });
                vectorLayer = new ol.layer.Vector({
                    source: new ol.source.Vector({
                        url: "http://earthquake.usgs.gov/earthquakes/feed/v1.0/summary/2.5_day.geojson",
                        format: new ol.format.GeoJSON()
                    })
                });
                map.addLayer(vectorLayer);

                $(document).keypress(function () {
                    var fts = vectorLayer.getSource().getFeatures();
                    $("#info").html("");
                    for (var i = 0; i < fts.length; i++) {
                        $("#info").append($("<p>").html(fts[i].get("title")));
                    }
                });
            });
        </script>

        <style type="text/css">
            #map {
                width: 100%;
                height: 100%;
            }

            #info {
                position: absolute;
                top: 15px;
                left: 60px;
                background-color: #fff;
                padding: 5px;
                font-size: small;
            }

            p {
                margin: 0;
            }
        </style>
    </head>
    <body>
        <div id="map"></div>
        <div id="info"></div>
    </body>
</html>
TODO
- On souhaite supprimer l'interaction imposée à l'utilisateur (keypress) pour afficher la liste des descriptions. Comment faire ? Qu'est-ce qui ne marche justement pas ?
- Remplacer le callback keypress par ce qui suit :
// Set listener on addfeature (ol.source.VectorEvent) vectorLayer.getSource().on("addfeature", function (e) { $("#info").append($("<p>").html(e.feature.get("title"))); }); - De nombreuses propriétés des classes OpenLayers sont “observables”, comme celles de la classe ol.View. Ajouter à l'exemple ce qui suit :
// Set listener on change:center (ol.ObjectEvent) map.getView().on('change:center', function (e) { $("#info").html("Center of the map: " + e.target.getCenter()); }); - Adapter l'exemple pour que soit automatiquement utilisé comme baselayer une couche Bingmaps dès que le niveau de zoom passe à une échelle plus grande que le niveau 6 (à la http://urbangene.heig-vd.ch).
Ex7B : contrôle d'interrogation en mode image (WMS GetFeatureInfo)
Le gestionnaire d'événements cartographiques va notamment servir à déployer la dernière fonctionnalité de base d'une application de webmapping, celle qui consiste à interroger les objets de la carte.
Cet exemple illustre l'interrogation des objets de la carte par le simple clic d'un pixel sur la carte. On enregistre un écouteur sur la map à l'aide de la méthode ol.Map.on afin d'exécuter du code lors d'un click sur la map. On utilise ensuite la méthode ol.source.ImageWMS.getGetFeatureInfoUrl pour construire l'URL qui permet d'interroger le WMS. Enfin, la fonction getFeatureInfo(url) permet d'envoyer une requête au serveur WMS à l'aide de l'URL précédemment construite.
<html>
    <head>
        <title>ol3 - Ex7B - interaction with WMS GetFeatureInfo control</title>
        <script type="text/javascript" src="js/config.js"></script>
        <script type="text/javascript">
            var map, wmsLayer;

            $(document).ready(function () {
                map = new ol.Map({
                    target: 'map',
                    view: new ol.View({
                        center: ol.proj.transform([6.7, 46.7], 'EPSG:4326', 'EPSG:3857'),
                        zoom: 4
                    })
                });

                var wmsLayer = new ol.layer.Tile({
                    source: new ol.source.TileWMS({
                        url: myOWS,
                        params: {
                            VERSION: "1.0.0",
                            LAYERS: "worldadm",
                            FORMAT: "image/png"
                        }
                    })
                });
                map.addLayer(wmsLayer);

                map.on('singleclick', function (evt) {
                    var wmsSource = wmsLayer.getSource();
                    var url = wmsSource.getGetFeatureInfoUrl(
                            evt.coordinate,
                            map.getView().getResolution(),
                            "EPSG:3857",
                            {
                                INFO_FORMAT: "text/html"
                            }
                    );
                    if (url) getFeatureInfo(url);
                });

                function getFeatureInfo(url) {
                    var url2 = encodeURIComponent(url);
                    var request = $.ajax({
                        url: "php/proxy2.php?url=" + url2,      // oui, on a besoin d'un proxy !
                        dataType: "text"
                    });

                    request.done(function (data) {
                        $("#info").html(data);
                    });

                    request.fail(function (jqXHR, textStatus) {
                        alert("Request failed: " + textStatus);
                    });
                }
            });
        </script>

        <style type="text/css">
            #map {
                width: 100%;
                height: 100%;
            }
            #info {
                position: absolute;
                top: 20px;
                left: 60px;
                background-color: white;
                border: solid gray 1px;
                padding: 5px;
                font-size: smaller;
                z-index: 1000000000;
            }
        </style>
    </head>
    <body>
        <div id="map"></div>
        <div id="info">Click on the map to get feature info</div>
    </body>
</html>
TODO
- Modifier encore une fois INFO_FORMAT comme suit :
INFO_FORMAT: "application/json",
que se passe-t-il à l'interrogation de la carte ? Regarder le flux client/serveur … et exploitez-le pour n'afficher que le nom de pays.
- Encore mieux en deux étapes :
- ajouter une couche vecteur :
vectors = new ol.layer.Vector({ source: new ol.source.Vector() }); map.addLayer(vectors); - remplacer la fonction getFeatureInfo par celle-ci :
function getFeatureInfo(url) {
    var url2 = encodeURIComponent(url);
    var request = $.ajax({
        url: "php/proxy2.php?url=" + url2,
        dataType: "text"
    });

    request.done(function (data) {
        decoder = new ol.format.GeoJSON();
        features = decoder.readFeatures(data, {
            dataProjection: "EPSG:4326",
            featureProjection: "EPSG:3857"
        });
        //console.log(features);

        if (features.length > 0) {
            vectors.getSource().clear();
            vectors.getSource().addFeatures(features);
            $("#info").html(features[0].get("NAME"));
        }
    });

    request.fail(function (jqXHR, textStatus) {
        alert("Request failed: " + textStatus);
    });
}
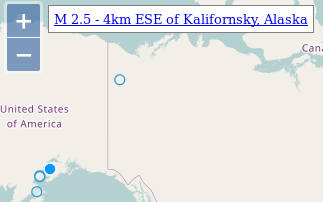
Ex7C : Interaction sur entités vectors
Après les utilisations possibles pour interagir avec les entités représentées par les services cartographiques, voyons comme interagir directement avec les entités vectors “vivantes” client-side. On tulise pour cela le concept d'ol.interaction, notamment ol.interaction.Select.
<html>
    <head>
        <title>ol3 - Ex7C - Interaction sur entités vectors</title>
        <script type="text/javascript" src="js/config.js"></script>
        <script type="text/javascript">
            var map;
            $(document).ready(function () {
                map = new ol.Map({
                    view: new ol.View({
                        center: [738600, 5840171],
                        zoom: 3
                    }),
                    target: 'map',
                    layers: [
                        new ol.layer.Tile({
                            source: new ol.source.OSM()
                        })
                    ]
                });
                vectorLayer = new ol.layer.Vector({
                    source: new ol.source.Vector({
                        url: "https://earthquake.usgs.gov/earthquakes/feed/v1.0/summary/2.5_day.geojson",
                        format: new ol.format.GeoJSON()
                    })
                });
                map.addLayer(vectorLayer);

                var selectInteraction = new ol.interaction.Select({
                    condition: ol.events.condition.singleClick,
                    layers: [vectorLayer]   // the layers on which the selection is possible
                });
                map.addInteraction(selectInteraction);

                selectInteraction.on('select', function (e) {
                    if (e.target.getFeatures().getLength() > 0) {
                        //console.log(e.target.getFeatures().item(0).getKeys());
                        var title = e.target.getFeatures().item(0).get("title");
                        $("#info").html(title);
                    }
                });
            });
        </script>

        <style type="text/css">
            #map {
                width: 100%;
                height: 100%;
            }
            #info {
                position: absolute;
                top: 20px;
                left: 60px;
                background-color: white;
                border: solid gray 1px;
                padding: 5px;
                font-size: smaller;
                z-index: 1000000000;
            }
        </style>
    </head>
    <body>
        <div id="map"></div>
        <div id="info">Select on the map to get feature info</div>
    </body>
</html>
TODO
- Utiliser l'ol.events.condition qui va bien pour avoir le comportement type “on mouse over”. Sans oublier de mettre l'IHM en cohérence (voir ol.interaction.Select.Event select).
- Configurer l'interaction de sorte que l'utilisateur puisse aussi cliquer sur la bulle d'information pour aller à la page des détails du séisme (cf propriété url, ex. https://earthquake.usgs.gov/earthquakes/eventpage/nc72722700)